Paul Krugman’s recent post indicates that perhaps those of us taking a stock-flow consistent approach to macroeconomics may be making some headway. My fellow blogger, Rob Parenteau, and another friend, Bill Mitchellboth describe many of the details of this approach and how they fit the graph posted by Krugman. Rob is correct to suggest this would be a much better framework for understanding macroeconomics than the traditional IS-LM model, which was highly flawed to begin. My purpose here is to build on both of these posts and demonstrate a few uses of the model (thus, those not familiar with this framework should read Rob’s and/or Bill’s posts first, probably).To begin, consider the graph in Krugman’s post below:
Figure 1: The Private Surplus-Public Deficit Graph from Krugman’s Post
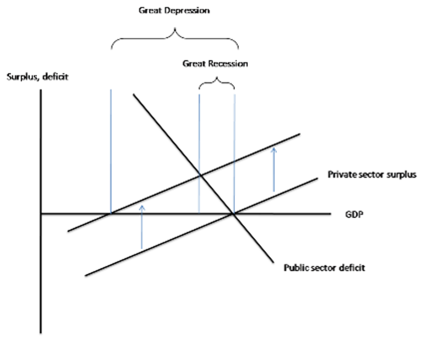
The private sector surplus represents the net saving of the private sector (households and businesses) from income after spending, while the public sector deficit is the government’s deficit. Krugman’s point in the graph is that the private sector has recently moved to deleverage substantially instead of spend and thereby raise its net saving, which has reduced GDP, though not as much as without the automatic stabilizers of fiscal policy (in his opinion, thankfully, since this was not present in the Great Depression . . . which would have had a much flatter public sector deficit curve). Much of the background for this graph was again discussed by Rob and Bill, so I’ll be brief here (those wanting more background should read Rob’s and/or Bill’s posts).
The graph isn’t finished, since, as Rob pointed out, we must add the international sector. To do this, and also to understand the graph itself (again, briefly here), consider the following standard macroeconomic accounting identity from any macroeconomics textbook:
(1) Private Saving – Investment = (Government Spending – Taxation) + (Exports – Imports)
Most neoclassical economists put private saving on the right-hand side of the equation and then multiply by -1, leaving investment equal to private saving, the government surplus, and foreign saving as a result of the trade deficit. This is shown in equation 2:
(2) Investment = Private Saving + (Taxation – Government Spending) + (Imports – Exports)
The right-hand side of equation 2 is usually referred to as “national saving” by neoclassical economists, and more “national saving” is thereby thought necessary to increase business investment and thereby increase the economy’s long run capacity to produce goods and services. This interpretation is nearly ubiquitous in the profession.
However, this interpretation is inapplicable except for a fixed exchange rate monetary system operating under a gold-standard or currency-board type of regime in which there is in fact a “fixed” quantity of savings that exists or can be created. But in our flexible-exchange rate monetary system, saving does not finance spending; indeed, banks create loans without any prior deposits or reserves being necessary, as I have explained in previous posts to this blog.
Those of us employing the framework of J. M. Keynes, Hyman Minsky, Wynne Godley, and others mentioned by Rob, instead use the above equation to understand the financial status of the various sectors of the economy. That is, instead of saving to finance capital investment (which is not actually what happens), we have “private sector net saving,” which is the addition/subtraction to net financial wealth for the private sector in a given period. If the private sector is net borrowing, then its balance will be negative; if it is net saving, then its balance will be positive.
Most importantly, the economy’s financial flows are a closed system, so one sector’s deficit is another’s surplus, and vice versa. There is no way around it, just as it is impossible for every country in the world to have a trade surplus—at least one country must have a trade deficit for the others to have surpluses. Thus, “national saving” as defined in the textbooks (private saving + government surplus + foreign saving) is a misleading concept in our monetary system, since if the government is “saving” some other sector (or combination of them) must not be, by definition.
For this reason, instead of equation 2, we write equation 1 as the following:
(3) Private Sector Surplus or Net Saving = Government Deficit + Current Account Balance
The trade balance (exports – imports) is not the precise term to use when considering all financial flows, the current account balance is. For the US, the two very close in magnitude. We’ll call equation 3 the Sector Financial Balances (SFB) equation. Again, this is an accounting identity, not theory. Disagreeing with it is akin to believing the earth is flat. For examples of this framework directly in use on this blog, see here and here.
Figure 2 shows how closely the private sector surplus and the government sector deficit have moved historically, which isn’t surprising given they are nearly the opposing sides of an accounting identity. The difference between them, more visible starting in the 1980s, is the current account balance.
Figure 2: Historical Behavior of Private Sector Surplus and Government Sector Deficit as a percent of GDP
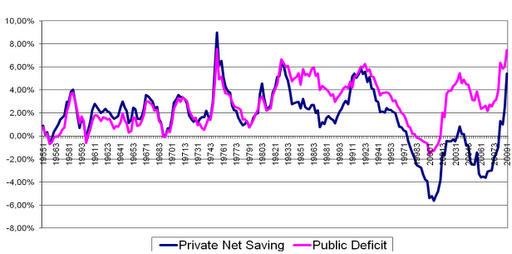
Figure 3 shows all three sector financial balances:
Figure 3: The Sector Financial Balances as a percent of GDP
Turning to a graph to represent equation 3, Krugman’s graph has the left-hand side (the upward sloping private surplus, since higher income means higher saving, ceteris paribus) of the equation and part of the right-hand side (the downward sloping public sector deficit). The easiest way to incorporate the current account balance is to add it also to the government deficit, since like the government deficit the current account also tends to be countercyclical (that is, as incomes rise, we spend more on imports and the trade balance worsens).
I have merged the two below in Figure 4, which shows a countercyclical government deficit (due to automatic stablizers) and a countercyclical current account balance that together combine to make the “Gov Def + Cur Acct” line (the green line, which is the other two lines added together). The horizontal axis shows GDP intended here to be the equivalent to the horizontal axis of the textbook Keynesian cross model (that is, aggregate income, but not necessarily in the sense of capacity to produce goods and services).
Figure 4: The Gov Def + Cur Acct Line, or Right-Hand Side of Equation 3
Figure 5: The SFB Model of Aggregate Demand
Figure 6: The Economic Expansion of the 1990s
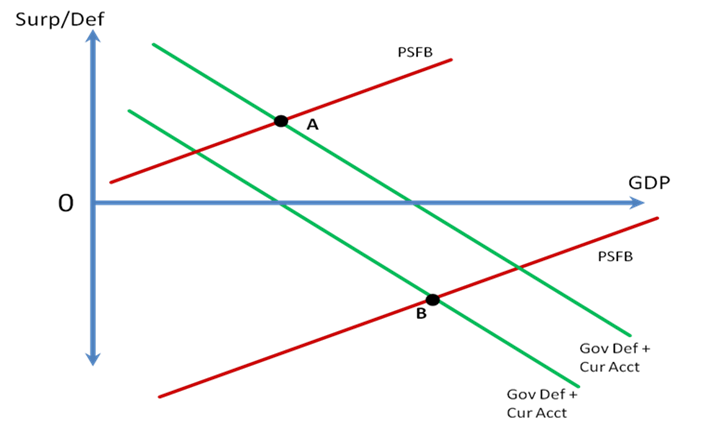
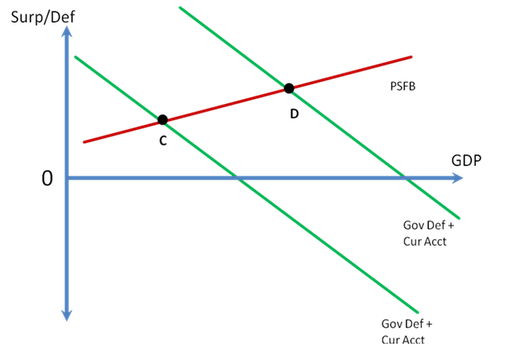
Figure 7 depicts this in the SFB model (Bill Mitchell produced a similar graph and discussion of the model in his post . . . highly recommended as well, with a bit more graphical detail than mine). The economy is currently at a point like C after a steep rise in the PSFB line that significantly reduced GDP while automatic stabilizers and an improvement in the current account balance that raised private net saving (as shown in Figures 2 and 3) limited the decline. A well-designed and sufficiently large fiscal stimulus would shift the Gov Def + Cur Acct line up and move the economy to a point like D, with higher real GDP and a higher private sector financial balance.
Figure 7: The Appropriate Fiscal Policy in the Current Environment
The SFB model shows the folly of concerns that households will simply “save” any tax cuts they receive; because the private sector desires to net save right now, if a given stimulus is not enough to quench the need to deleverage and raise GDP, then the answer is in fact more stimulus to enable the desired deleveraging.
Of course, the recession could also be ended if the PSFB line shifted down to raise real GDP, but that implies an increase in private sector leverage, which is the opposite of what the private sector is currently attempting. This explains why using monetary policy—interest rate cuts to encourage borrowing—probably won’t work aside from reducing debt service burdens (while it also reduces income for savers, which again decreases the private sector’s financial balance by reducing government interest payments . . . a slight shift down of the Gov Def + Cur Acct line). Some other ideas popular in economics blogs related to negative nominal interest rates, such as the currency tax—which penalizes those holding transaction balances, and possibly other liquid balances, in an attempt to encourage spending—or the excess reserve tax—which attempts to move short-term, liquid investments into deposits or currency that will then be spent (or so those in support assume)—similarly attempt to raise real GDP by shifting the PSFB line down, and would thus also “work” by reducing the private sector’s financial balance.
In closing, the SFB model of aggregate demand can illustrate rather easily and clearly macroeconomic events and the effects of policies in a stock-flow consistent manner. As Rob explained, it would be a very good replacement for the IS-LM model of aggregate demand. There are many, many other things that can be demonstrated with the model that I don’t have time to go into right now. For instance, the employer of last resort policy proposal is an attempt to make the Gov Def + Cur Acct line vertical at the full employment level of GDP; or, as another example, the SFB model shows that aggregate demand is set by the government’s deficit relative to net savings desires of the non-government sectors (as Warren Mosler says, the government’s deficit is the “M” in the quantity theory of money, while the net savings desires of private sector are the inverse of the “V” in the equation).
Dear ScottNice post and links well with the others on this theme.However, in my own earlier blog on this topic that you refer to I did include the external sector in the sense that I did the analysis in terms of the government and non-government sector.As you know, there are only distributional issues involved once you decompose the non-government sector into foreign and domestic.So in terms of the broad national accounting relationships that we are talking about in this context, you can get most of the basic points across at that level of aggregation.But your explicit breakdown is excellent.best wishesbillbest wishesbill
Hi BillYes, true enough. It wasn't intended as a criticism, of course, though I have since deleted that point in the text. I frequently talk about it much the same way as you did for the same reasons.Best,Scott
Great post. I think we can find the same kind of ideas in the latest texts of William Vickrey and I add that the historical root of these way of thinking is not the General Theory, but the others texts of Keynes, and, of course, Kalecki.And thank you very much for your blog. It is very "rafraîchissant".(Sorry for my English, I am French…)
Dear SerenisThank you! No worries on the English . . . yours is far better than my French!Yes, agree . . . we are all fans of Kalecki, as well.Best,Scott
Scott,Sorry, I really have to disagree with your preamble.There’s nothing irreconcilable or in applicable about any of these equations.The concept of net private sector savings is a neat way to isolate the fact that the sum of financial assets and liabilities is zero – because every asset is a liability. And it’s an interesting perspective. But it doesn’t mean the conventional representation is wrong, per se. It merely includes gross real investment and the equivalent level of saving that is an offset by identity.When you say that savings doesn’t fund investment, I can only interpret that as suggesting that investment expenditure generates the income and the saving requiring to “fund” the investment that is the source of the process. I.e. investment is self-financing in the sense of the macro identities. That I would agree with. But I don’t see how you can disagree with it otherwise.These are all just rearrangements of the same equation, making exploring the causality more interesting and realistic.The fact that you define net private saving as gross saving minus investment doesn’t suddenly making the conventional inclusion of investment wrong.And I don’t see why there’s any relationship between the rearrangement of the identity and the presence or absence of a fixed exchange rate system. The fact that banks can create loans without reserves has nothing to do with changing these identities. It merely creates new sector financial assets and liabilities that sum to zero. Indeed, at the instant the loan is made, the borrower is the depositor, so there is no effect whatsoever even within the sector. This in itself is a balance sheet transaction that is irrelevant to the saving question in any representation, until the funds are routed further into consumer expenditure, real investment, or some other configuration of financial assets that has nothing to do with expenditure or real investment. There is nothing in that initial or ensuing dynamic that contradicts any of these equations.
Scott,Sorry, I have to disagree with your preamble.There’s nothing irreconcilable or inapplicable about any of these equations.The concept of net private sector savings is a neat way to isolate the fact that the sum of financial assets and liabilities is zero – because every asset is a liability. And it’s an interesting perspective. But it doesn’t mean the conventional representation is wrong, per se. It merely includes gross real investment and the equivalent level of saving that is an offset by identity.When you say that savings doesn’t fund investment, I can only interpret that as suggesting that investment expenditure generates the income and the saving requiring to “fund” the investment that is the source of the process. I.e. investment is self-financing in the sense of the macro identities. That I would agree with. But I don’t see how you can disagree with it otherwise.These are all just rearrangements of the same equation, making exploring the causality more interesting and realistic.The fact that you define net private saving as gross saving minus investment doesn’t suddenly making the conventional inclusion of investment wrong.And I don’t see why there’s any relationship between the rearrangement of the identity and the presence or absence of a fixed exchange rate system. The fact that banks can create loans without reserves has nothing to do with changing these identities. It merely creates new sector financial assets and liabilities that sum to zero. Indeed, at the instant the loan is made, the borrower is the depositor, so there is no effect whatsoever even within the sector. This in itself is a balance sheet transaction that is irrelevant to the saving question in any representation, until the funds are routed further into consumer expenditure, real investment, or some other configuration of financial assets that has nothing to do with expenditure or real investment. There is nothing in that initial or ensuing dynamic that contradicts any of these equations.
Serenis – Keynes understood this approach, although perhaps he did not set it up as clearly and explicitly as Scott, Stephanie, and now Krugman have with the above financial balance diagrams. Arguably, it begins to show up in the Treatise when he is working with his macro theory of profits, (which is similar to the one Kalecki was developing independently, in parallel), basically dealing with the above model as a private sector only economy, with a business sector financial balance and a household sector balance. It then gets expanded to include a government finanical balance in the General Theory, and you can see the paradox of thrift in a financial balance light. Early Keynes students like Robinson, Kaldor, and especially Lerner got it. Vickrey got it, Godley got it, Minsky got it, and it was mostly up to the Post Keynesian school to carry it forward since most Keynesians went down the neoclassical synthesis route pitched by Hicks, Samuelson, and others, and a lot of the richness of the financial/real side interactions were at best overly simplified in the canonical ISLM diagram.So yes, you are correct: there is a larger tradition of macro thinking in the direction which Scott wonderfully summarizes above, and which some of us have been excavating and using over the past decade and a half to make sense of and anticipate the influence of financial imbalances on macrofinancial dynamics. You'll find a good body of work at the Levy Economics Institute that has applied and developed this framework. Our experience has been that is a very powerful lens, and we find it encouraging to see others like Paul Krugman in the profession are beginning to consider just how useful the financial balance approach can be in offering a stock/flow coherent way of thinking about macro. It really does cut through a lot of the nonsense and misconceptions that unfortunately still guide public debate and policy.
Hi JKHA few things . . . First, saving doesn't finance investment at the macro level as you note, but also not necessary at the micro level–loans create deposits.Second, of course, you can use any perturbation of the equation you want, it's an identity, after all. But neoclassicals use the investement = total saving version to imply causality from right to left. That's the problem, as it leads to all sorts of bad analysis and bad policy proposals. I can't think of one neoclassical who uses that version yet also understands that government deficits by definition create private net saving.Third, if saving doesn't drive investment, then what is the most useful way to set up the identity. We suggest it is to understand the net financial balances of the sectors, a la Minsky. You don't get Minskyan understanding from the conventional arrangement of the identity. In fact, "gross national saving" is really non-sensical, since there's no such thing if one sector's net saving is another borrowing.Fourth, the concept of "gross national saving" applies only to a fixed-exchange rate gold standard or currency board. I specifically did NOT say fixed exchange rates without gold standard or currency board.Best,Scott
Scott,Thanks. I can certainly see where I = S implies an “inefficient” causality and obscures the kind of thinking you’re after. I was hoping that was the rationale for the rearrangement of the equation.I’ve always tried to “look through” the conventional equation in order to see the real nature of sector saving imbalances. The conclusion I’ve come to is that you can characterize the relationship between the macro I = S and the sector components beneath that by noting that it is very possible (obviously) for sector saving to be negative but it is not possible for sector (gross) investment to be negative. Government dissaving and current account deficits are the glaring examples of this. That to me is the logic that allows the decomposition and rearrangement of the equation as you have it – it reveals the negative sector saving imbalances. Of course, this logic can be taken further by drilling down within sectors – such as the negative saving by some households (big mortgages) and the positive saving by others (financial assets).The other interesting point of logic, which is evident in the rearrangement, is that sector saving expressed on a net basis is independent of the level of investment, at least as an identity. This reflects the fact that sector imbalances expressed on the net basis are representable exclusively in financial asset form. This tells you nothing about the level of investment, but provides critical information on sector imbalances apart from that. These are two different purposes.Coincidentally, Warren Mosler provided a bit of a primer on the fixed/floating exchange rate aspect in a comment he made on his blog today. (See http://www.moslereconomics.com/2009/07/17/federal-taxation-for-dummies/comment-page-1/#comment-8880 ). I’ve never quite understood why this differentiating aspect is so critical to the view expressed there and here. Quite frankly, I’m still not there. It seems to me the only critical issue is sustainability. You can’t print money indefinitely in a gold standard system because there will be a run on gold, and the standard will have to be reset or abandoned. But that prohibition applies to a fiat system as well, if you assume the central banker has the guts to raise interest rates sufficiently in order to prevent the “run” on the currency (in terms of either domestic or foreign value). I’m not convinced this fixed/floating distinction is so central to the ideas expressed there and here. I get it as illustration, but I don’t get it as necessary.Finally, there is one point I’d still disagree with you on. You say the fact that loans create deposits is evidence that saving doesn’t finance investment at the micro level. I think this is wrong. At the level of accounting, saving is an income statement measure while loans and deposits are a balance sheet measure. The fact that loans create deposits reflects the nature of a transaction that is essentially an asset swap. I create an asset for the bank by issuing a liability, and the bank creates an asset for me by issuing its liability. This pure asset transaction has nothing directly to do with measured saving. Indeed, I can leave the money in the bank and do nothing further if I like.If I proceed subsequently to spend the money I’ve borrowed, saving imbalances start to be affected. But this happens only at that stage, and not at the start, where the loan creates the deposit as the result of a balance sheet transaction or asset swap.Rather than use the relationship that loans create deposits, I would observe instead that production creates income as an identity (with the help of the banking system in order to bridge time lags in the monetary system). The production that is new capital goods (i.e. investment) creates the amount of income that must be saved in order to fund investment (the necessary amount of macro income; not necessarily the specific micro income applied and matched to this purpose per se).
Scott,I should have mentioned also, I don't understand at all the final point, which seems to be fundamental to the whole concept, where gross national saving only applies to fixed rate regimes. How does this negate S = I ?What is the income offset to I if not saving?
Great and thought-provoking post.As a Japanese amateur-economist, I have been toying with a question related to this matter for some time.In late 1980s, we ran current account surplus from the export to the US, which meant current account deficit for the US. We were blamed a lot for that current account imbalance, but the sin of causing financial bubble in the US was not among the accusations.However, this time, many people point a finger at Asian current account surplus for causing the bubble. What made this difference?I think one possible answer is the difference in position of private sector of both periods. That is, in 1980s, private sector's net saving was positive, and the economy was in the upper half of the diagram of your model, such as point A in Figure 6. But, since late 1990s, the economy moved into the lower half of the diagram, such as point B in Figure 6. And Figure 2&3 shows that each time that negative value of private sector's net saving became large, there was a bubble — dot-com bubble around 2000, and housing bubble around 2006.Do these facts suggest that point B, or the lower half of the diagram of your model, is more susceptible to bubbles than point A? And if that is the case, should the government try to maintain budget deficit larger than current account deficit, so that they can keep private saving positive and prevent bubble?I know this is a wild idea, but hopefully it may serve as food for thought.
Scott,Another way of stating the point I was making earlier is that there is no change in sector financial balances due to a financial asset swap – whether the swap occurs within or between sectors. The transaction whereby a loan creates a deposit is effectively a financial asset swap (customer swaps loan obligation for money; bank vice versa).
Dear JKHOnly little time, so will only deal with this one point here and the rest later.I think I understand your point on asset swap. You are arguing that, for instance, if I go to the bank and borrow, and then spend, this is not a net change in the private sector balance. So, while spending increased, it can't show up anywhere on the graph. Is that roughly it?Assuming so, let me explain, because you're not understanding the graphs I presented if that's the case.In the case above where I borrow and spend, this is a shift down of the PSFB line … desire to leverage is a shift factor. This moves us along the Gov Def + Cur Acct line to higher real GDP. But why?Because as I increase spending, this increases tax revenues for the govt (from sales, income of the seller and his/her employees, perhaps less need for unemployment benefits, etc.). The automatic stabilizers, basically. So, the govt's deficit falls in the process. Also, some effect on the current account balance, as incomes have risen through multiplier process.By how much? This depends on the slope of the gov def + cur acct line. Let's ignore the current account part here to make it easier. The slope of the gov deficit line will be set by the "responsiveness" of the automatic stabilizers to increased/decreased aggregate spending. The more responsive, the more vertical, and the less my borrowing/spending raises real GDP, and vice versa.Consider a government that is completely unresponsive … head tax with fixed per capita spending, perhaps. It's gov deficit line is horizontal. Ignoring current account line again, my borrowing and spending reduces the PSFB line and just moves me along the gov deficit line to a higher real GDP. Sector balances are unchanged, but spending has risen.As I said in the paper, AD is set by net savings desires of pvt sector relative to government deficit.Hope that all makes sense.Best,Scott
Sorry, Scott. My point is much, much simpler. So much so you may consider it trivial and a waste of time.But my point is simply that the act of a bank creating a deposit by making a loan is entirely separate from the act of spending or generating income. The loan/deposit transaction has no effect directly on economic activity as measured in such concepts as expenditure, income, GDP, etc.It’s on this basis I have a problem with the statement:“First, saving doesn't finance investment at the macro level as you note, but also not necessary at the micro level–loans create deposits.”I have a problem with it, not because I necessarily disagree with the idea that saving doesn’t finance investment, but because I disagree with the fact that the idea that loans creates deposits has anything DIRECTLY to do with saving or investment. Saving and investment are flow concepts that require current period income; the creation of a deposit from a loan is a balance sheet transaction that has nothing directly to do with flows or current period income. Mathematically, it’s an instantaneous balance sheet balancing, not a balance sheet net change (i.e. equity change) that results from current period income flow.Changes in the government’s financial balance or in the private sector’s financial balance are obviously reflected in balance sheet changes. But they are balance sheet changes that result directly from expenditure and saving patterns; e.g. government spends itself into deficit; private sector saves itself into net savings surplus. These are the necessary transactions. In my terms, they necessarily affect the equity position of the sector, where equity is equivalent to cumulative saving or dissaving (marked to market if you like, but that’s a measurement detail – visualizing cumulative book value change is a good simplification for illustration.)But the idea that loans create deposits is not a sufficient premise to generate such sector profile changes, because such pure balance sheet transactions are detached from expenditure and income activity. There is no sector equity change when a loan creates a deposit; there is no net profile change to the sector financial balance. Neither is there in a more general pure asset swap where both assets are pre-existing prior to the current accounting period.The general version of the asset swap is simply an exchange of one asset for another, where the asset is an existing stock and not captured in current period output or income. E.g. exchange of money for common stock, exchange of an existing house for money, exchange of a mortgage for money, exchange of a loan for a deposit, etc. etc. None of these exchanges DIRECTLY impact expenditure or income.From an accounting perspective, these are all balance sheet transactions that do not intersect directly with income statements.That only happens when you start mobilizing the money from such an exchange.Another example of this is the US phenomenon of mortgage equity withdrawal (MEW). The mortgaging of an existing house to "extract equity" is such a pure balance sheet transaction with no direct effect on expenditure or income. It's an asset swap – mortgage for cash.But the use of funds obtained to spend into the economy then obviously has a potential impact on macro expenditure and income patterns and sector financial balances.The balance sheet transaction is separate from the deployment of money obtained in the transaction.The mortgage created the deposit.But it was spending from the deposit that had the ultimate effect on the private sector net saving profile, e.g. perhaps because it contributed directly to the current account deficit via the Walmart effect.That's all. Simple stuff, but important I think, to be clear on the logic.And this is all preamble – I’m embarrassed to say I haven’t even gotten to your graphs. But I can’t get to them before climbing my way out of the basement foundation.
Hi JKH,My point was that the act of spending, at the micro or macro levels, does not require prior saving or savings. AT the micro level, when I said "because loans create deposits," I meant in the sense that, if I buy a new refrigerator with my credit card, no prior saving or savings was necessary to create the deposit that was transferred to the ownership of the seller buy my act of borrowing to spend.I did NOT at all mean to imply that ANY loan to create a deposit is necessarily linked to an act of spending. I certainly do NOT believe that.Sorry for any confusion. Hope I got it this time.Indeed, it seems to me that much of your most recent post above could be instead copied and pasted for those in favor of the excess reserve tax to see. They are the ones that seem to think that the creation of a bunch of deposits, whether via loans or via reclassification of existing short-term balances, will directly and necessarily increase spending.Best,Scott
OK, Scott, that’s clear for me now.I’m sure it was an obvious point. But it still helps to think of it clearly in terms of GDP type expenditure funded by credit, which in turn creates money. The credit card is a great generic example of an integrated borrowing/spending transaction in this sense, although even that doesn’t quite work all the time. E.g. the counterexamples of purchasing common stock or old art funded by credit – don’t quite work except for the broker’s fees or auctioneer's commissions. New refrigerators pass the test with a 100 per cent grade.
Dear HimaginarySorry for the delayed response. Good questions."However, this time, many people point a finger at Asian current account surplus for causing the bubble. What made this difference?"Yes, many certainly do blame foreign savings "glut" for the bubble now, but didn't earlier. Good point ,and underscores how little it's understood that saving doesn't "finance" anything. If you look at the chart, you will note that the PSFB did fall about 5% of GDP during the 1980s expansion, even as it didn't go negative, as you note. Further, if I were to break down the PSFB into the household and business sectors, a VERY sizeable decline in the business sector balance is seen . . . this is the leveraged buyout mania and so forth of the 1980s. That's where I think you would find what you are looking for in the 1980s, as the household sector remained net savers until the late 1990s."Do these facts suggest that point B, or the lower half of the diagram of your model, is more susceptible to bubbles than point A?"Not necessarily. Point B is actually following a bubble (though another one did ensue, as you note). In terms of bubbles, point A might actually be more susceptible, as Minsky taught us that stability is destabilizing. But overall how/when you get bubbles is much more complex than the graph can depict. I would say, instead, that point A shows a private sector in better/more stable financial standing than point B does. But where the economy moves from there in terms of financial stability/instability is not the purpose of the graph."And if that is the case, should the government try to maintain budget deficit larger than current account deficit, so that they can keep private saving positive and prevent bubble?"I would argue that the government should adjust the deficit to keep full employment level of GDP, as Daniel discusses in more depth in his subseqent post. Again, how big this would be depends on so many things I wouldn't want to give a one size fits all answer.Best,Scott
Hi Scott
Banks’ business model in its simplest form is to profit from lending (though I guess it’s also possible to profit from loss on lending if you hedge etc.). Banks are licensed to create credit in the way of ‘deposits create loans’, but this is not costless. Banks also appear to borrow abroad and then lend this credit to borrowers in the country of their operation. If the bank business model holds then you’d presume that the second source of lending is probably cheaper? Is this question too off post? I’m interested in how the current account balance is formed because this figures in the liabilies that banks accumulate and seems to be an important part of the financial chaos underlying the apparent smoothness ofnational accounts.
Jim
Jim