Employing Krugman’s Cross: Farewell, Mr. Hicks?

By Robert Parenteau

Paul Krugman’s July 15th blog post diagramming financial balances makes some important steps in revealing the analytical power of the financial balance approach to macroeconomics – something once understood by J.M Keynes and early Keynesians like Nicholas Kaldor, Abba Lerner, and Joan Robinson, but long since lost in the headlong rush over the past three decades of mainstream macroeconomics to become a special branch of microeconomics, which itself appears to have become a special branch of applied calculus in some sort of rather twisted physics envy. I suspect reading Minsky has helped Paul immeasurably in seeing these relationships, and I would urge him and others to go find some of Wynne Godley’s contributions (many of which are available online at the Levy Economics Institute) to a stock/flow coherent macroeconomics, and it may all become that much clearer.

The diagram Paul presented at first (reproduced below) threw me for a loop, but I believe I now see what he was doing, as the labeling did not initially make it clear, and perhaps by walking through Paul’s diagram, others can avoid my initial confusion.
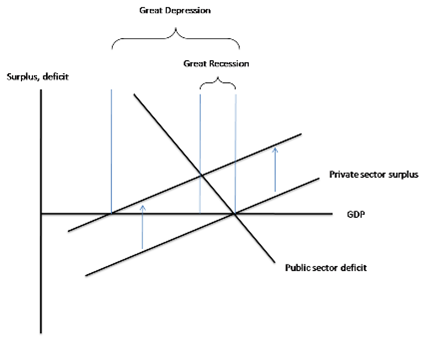

The upward sloping line should be labeled the private sector financial balance (PSFB), and the downward sloping line should be labeled the government financial balance (GFB). Only the part of the PSFB schedule above the horizontal axis is in surplus, if this horizontal GDP axis crosses the vertical sectoral financial balance axis at zero. Similarly, only that part of the GFB schedule above the horizontal axis is in deficit. I believe Paul has defined the vertical axis such that the range above zero represents a rising PSFB, and at the same time, a falling GFB of the same absolute amount, but of opposite sign. Then the area below zero is a falling PSFB and a rising GFB. Above zero represents a private sector financial surplus and a government deficit, while below zero represents a private sector deficit and a government surplus.

Confusing at first, but this follows because Paul has simplified the analysis to two sectors, and sectoral financial balances must balance ex post for any accounting period. The range above zero representing a private sector surplus must also represent a government deficit (GFB must be of equal magnitude but opposite sign to the PSFB). This would seem consistent with Paul’s GFB schedule falling below zero as GDP increases, since a falling fiscal deficit would eventually give way to an increasing fiscal surplus as income increases if automatic stabilizers work as we believe they do (see previous post here). Similarly, the rising PSFB schedule is consistent with traditional Keynesian stability conditions, with saving increasing faster in income than investment does, although we should all keep in mind, as Minsky emphasized, that explosive growth dynamics (Minsky’s upward instability) can arise in economic expansions characterized by euphoric asset pricing. Hence, the last two US business cycle expansions have been characterized by a falling PSFB (that is, deficit spending by the household and business sectors combined), not a PSFB rising as income rises, but that can be accommodated in less simplified versions of Krugman’s cross.

Another way to see why this interpretation of the diagram must be correct is that when the PSFB schedule shifts up and to the left, representing a higher desired net private saving at each level of income, the new point of intersection with the GFB schedule would, for example represent a new short run equilibrium point where say a $250b net private saving position is met by a $250b fiscal deficit. Again, sectoral financial balance must balance ex post (as explained in prevoius posts here and here). If one sector is running a net saving or surplus position, the other sector must be dissaving or deficit spending. That is the tyranny of double entry book keeping – not high Keynesian theory.

If I now have the orientation of the diagram straight in my head (and this is the only way I can see that it makes sense), those who believe in fiscal rectitude may wish to notice two aspects of the world we live in. If you view a balanced fiscal budget as the ultimate and over riding goal, you can get there one of two ways from Paul’s second PSFB schedule (the higher line we seem to have shifted to, as asset prices and profitability have collapsed over the past year, thereby forcing lower private investment and driving saving out of private income flows higher).

To arrive at a fiscal balance, you can shift the GFB schedule down and to the left by jamming tax rates higher and lowering the government spending propensities out of tax revenue income until the GFB schedule intersects the PSFB schedule at the point where the PSFB schedule crosses the horizontal axis at the zero financial balance mark. Notice the level of income the economy is then operating at, and all of you who pay dues to the Concord Coalition, please consider whether existing private debt loads could actually be serviced at that lower level, since most private debt contracts are fixed nominal payment commitments. Think post Lehman bankruptcy, on steroids, and you might get a taste of what you are praying for with perpetually balanced fiscal budgets.

The second way to get to a fiscal balance is to encourage the PSFB schedule to shift down and to the right until it intersects the GFB schedule at the point at which it crosses the horizontal axis. That means increasing incentives for the private sector to invest more money at each income level and save less money at each income level. Given the residential housing stock overhang, and the need for households to save out of income flows if they cannot rely on serial asset bubbles to deliver the appropriate nominal net worth at retirement, that means ways must be found to encourage US businesses to pursue a higher reinvestment rate in the US, rather than borrowing money to buy back shares to boost stock prices or reinvesting abroad. Not easy, but not impossible either. Notice also that the second form of adjustment leaves you at a higher equilibrium income level, and the existing private debt to GDP ratio will stabilize, since there will be no additions to the private debt stock, as net private deficit spending is zero at the new income flow level.

Of course, this should all eventually be recast in dynamic terms. For example, income won’t grow unless the GFB is continually shifting up and to the right, or the PSFB is continually shifting down and to the right (or some combination of the two). There is also no obvious endogenous mechanism shifting the PSFB toward a position of full employment income over time, given the position of the GFB. Of course, in theory, policy could be geared such that given reasonable estimates of the likely position of the PSFB schedule, the GFB schedule could be shifted out (or less likely, in) to achieve the level of income associated with full employment. Alternatively, fiscal policy could be structured so the GFB schedule could be perfectly vertical at the full employment level of income, which in many ways is what an employer of last resort (ELR) driven fiscal policy attempts to do.

Finally, for those insistent that public and private debt to income ratios must be held fixed from here to eternity for whatever reason, then starting from Paul’s initial equilibrium, income growth could only be accomplished if the PSFB schedule could be encouraged to shift outward, and the GFB could be shifted in concert such that either the realized financial balances of both sectors were kept at zero, or there was some cycling between the two, such that periods of private sector financial deficits were followed by periods of government sector deficits of similar magnitude and duration.

The trade balance must also be brought back into the story, as a trade surplus is the only way both the GFB and the PSFB can maintain a net saving position at the same time (assuming for whatever reason that was a worthy goal), but at least it is a promising start at representing how sectoral financial balances are related, and it reveals many of the misconceptions that unnecessarily cloud the debate.

If the Krugman Cross does nothing more than provide a stepping stone away from the dead end trap of the Hicks/Harrod/Meade IS/LM diagram, then this is a useful initial contribution. Caught under the spell of IS/LM conventions, Paul and other New Keynesians have spilled far too much ink trying to devise ways of instituting negative real interest rates to get the economies out of a balance sheet driven recession. With policy rates near zero, this analysis has devolved into arguments about how best to increase inflation expectations or actual inflation in order to achieve a sufficiently negative real interest rate. From a practical point of view, the last thing households facing heavy debt servicing loads with falling wage and salary incomes need are rising consumer prices that drain their already reduced discretionary income. Households need higher money incomes, not higher consumer prices, expected or actual, to exit their current difficulties. Real interest rates are diversion from the real problem at hand in a balance sheet recession, which is how to get the economy to a point where money income levels can service most private debts. Krugman’s Cross makes it obvious – shift the GFB schedule in response to shifts in the PSFB schedule.

As always, we must be careful about sliding between the usual ex ante/ex post distinctions, as the income multiplier lies masked behind these interactions, as does the reconciliation of new liability issuance with portfolio preferences, among other balance sheet and asset price considerations that must be brought into play for a coherent stock/flow macroeconomics, of which Hick’s IS/LM approach was a pale shadow that concealed more than it revealed.

For example, the private sector may plan to net save more at any given expected income or GDP level, but unless some other sector net saves less or deficits spends more, private incomes will adjust downward, and the desired private net saving will be thwarted, paradox of thrift style. If Paul recalls his reading of Keynes’ General Theory (and he is to be applauded for being one of the few New Keynesians to actually read Keynes in the original), this is one of the reasons Keynes argues incomes adjust to close gaps between intended investment and planned saving. Interest rates do not equilibrate investment and saving – incomes do, in Keynes’ General Theory. Paul has taken a very large step in this direction with his financial balance diagram, which hopefully he will find more powerful than his IS/LM analytics which he employed in the case of the Japanese balance sheet recession.

Specifically, Paul refers to the need for net private saving being “absorbed” by the public deficit spending. That assumes the net private saving can exist without some other sector deficit spending at the same time, which is impossible. William Vickrey and James Tobin used to make a similar slip, with Vickrey arguing the private saving had to be recycled by public deficit spending (see Vickrey’s otherwise useful piece on 15 fundamental fallacies, linked at CFEPS here.

In Paul’s 2 sector model, unless the public sector spends more money than it takes in as tax receipts, the private sector cannot earn more money than it spends, no matter what its plans or intentions or ex ante designs. Net private saving is created, allowed, or constrained by the size of the public deficit. Net private saving cannot exist as anything more than a hope and a prayer unless some other sector is willing and able to deficit spend. Ex post, in a 2 sector model, as a matter of basic accounting, the net saving of one sector must be equal to the net deficit spending of the other. That is the short run accounting “equilibrium” or reality.

Moving beyond a simple 2 sector model to the world we actually inhabit, it is really as simple as this. The US household sector cannot net save in nominal terms (spend less money than it earns) unless some other sector (or combination of sectors) is willing and able to spend more money than it earns.

It can be the government, the business, or the foreign sector or some mix of the three that net deficit spends – take your choice. But keep in mind, of the three, a government with a sovereign currency (not convertible into fixed quantities of a commodity or another currency on demand) and no debt denominated in foreign currencies is the only one of those three that cannot go bankrupt and cannot default on its debt while continuously deficit spending – unless it chooses to default for some odd political reason.

The sooner we face this fundamental reality of contemporary monetary and economic arrangements, the better. It does not require swearing allegiance to high Keynesian theory – it is simply an accounting reality. Reject it, and you will also have to throw at least seven centuries of double entry book keeping out the window as well.

Since the US economy does appear to have entered a debt deflation spiral for the first time in a lifetime, and it does appears that the spiral has been contained for the moment by a reduction in the trade deficit and a surge in the fiscal deficit, it might be a good time for economists, investors, policy makers, and the general public to once and for all find some clarity on these questions regarding financial balances and the economy. Perhaps Paul’s simple back of the napkin diagram of financial balances takes us one step in that direction.

17 responses to “Employing Krugman’s Cross: Farewell, Mr. Hicks?

  1. "…lost in the headlong rush over the past three decades of mainstream macroeconomics to become a special branch of microeconomics, which itself appears to have become a special branch of applied calculus in some sort of rather twisted physics envy."Robert Haugen, Emeritis Finance Professor of the University of California Irvine criticizes this well. For example:View, understand, and then predict the behavior of the macro environment, rather than attempting to go from assumptions about micro to predictions about macro. – Robert Haugen — "The New Finance", 3rd Edition, page 123….as we travel from left to right, we go from order to complexity and finally into chaos.At the extreme left, where there is order, mathematical models predict and explain well [as in much of physics].As we move to the right, induction and statistical estimation dominate deduction and mathematical modeling in their ability to explain and predict… –"The New Finance", page 131.Financial economists, both rational and behavioral, dazzle themselves with sophisticated mathematics. They gain much comfort in the intellectual rigor of their methodologies.It makes no difference if their assumptions are completely unrealistic, so long as they parallel those made by their peers.To them elegance [advanced, complete, and impressive mathematics] is all that matters. They look with disdain on studies of psychologists, sociologists, and anthropologists because their work seems so mushy in comparison to their own. They dismiss, as unimportant forces that may actually be crucial but impossible to treat with mathematical rigor. –"The New Finance", page 132.For more on this, see my post, "Induction, deduction, and a model is only as good as its interpretation"

  2. Richard: There is a passage in a book I read a while back on complexity and chaos theory that describes a seminal meeting, I think in Santa Fe, between high powered economists and Nobel Prize winning physicists to explore possible bridges between disciplines.The economists stood up to show their best wares, scribbling away furiously on the whiteboard, trying their best to impress. The response of the physicists boiled down to this: "you guys don't really believe all that crap, do you?".I admire the intellectual fire power of many in the economics profession. I would not suggest every insight they derive must be dumbed down somehow so that even I can understand it. But at some point, relevance to the world we inhabit needs to kick in, and finding applications that can reduce some of the unnecessary suffering in the world might be a good idea too. Otherwise, what we get is unfortunately little more than intellectual masturbation – pardon my French – which granted, may have its place, mind you, but probably isn't terribly useful to anyone else if you just make a career out of it. Yet that tends to be the incentive structure many of them face. Fortunately there are heretics willing to fly in the face of those incentive structures – something few rational, own utility maximizing agents are supposed to do, but hey, some are still human.

  3. I don't see how this is different from the IS curve. Isn't the IS curve the set of (Y, i) combinations for which the private sector's net savings surplus is offset by the sum of the public sector's and the international sector's combined net savings deficits? Indeed, isn't that why it is called the IS curve–that it balances the flow-of-funds?

  4. How about this….The federal budget is on an unsustainable path, because federal debt will continue to grow much faster than the economy over the long run. Although great uncertainty surrounds long-term fiscal projections, rising costs for health care and the aging of the population will cause federal spending to increase rapidly under any plausible scenario for current law. Unless revenues increase just as rapidly, the rise in spending will produce growing budget deficits. Large budget deficits would reduce national saving, leading to more borrowing from abroad and less domestic investment, which in turn would depress economic growth in the United States. Over time, accumulating debt would cause substantial harm to the economy….Measured relative to GDP, almost all of the projected growth in federal spending other than interest payments on the debt stems from the three largest entitlement programs—Medicare, Medicaid, and Social Security. For decades, spending on Medicare and Medicaid has been growing faster than the economy. CBO projects that if current laws do not change, federal spending on Medicare and Medicaid combined will grow from roughly 5 percent of GDP today to almost 10 percent by 2035. By 2080, the government would be spending almost as much, as a share of the economy, on just its two major health care programs as it has spent on all of its programs and services in recent years.They have good charts too CBO

  5. Cynical -Government spending becomes someone's income – who could that be? What does it do to your denominator GDP, especially if the recipient of that income spends it on other goods and services?Interest expense on the public debt gets paid to someone – who could that be? What does it do the the denominator of your public debt/GDP ratio or your public deficit/GDP ratio?If the private sector is going to net save – that is, spend more money than it earns – and that is a good thing because it allows people to finance their own retirement or pay down their debt, who is going to spend more than it earns – deficit spend – so the private sector can actually achieve its net saving goal.Finally, households and nonbank businesses cannot create money – that is counterfeiting. Where do you think they get the money from in the first place to pay taxes and buy Treasury debt?Think these things through only if you are prepared to lose your delusions. Your choice.best, Rob

  6. Brad -Read Scott's recent post, and perhaps that will give you a deeper understanding of what is going on with the financial balance representation.On one abstract level, they both describe product market equilibrium conditions. But the IS schedule, which plots interest rate and income level combinations that yield investment equal to saving, conceals more than it reveals.Unsustainable financial flow imbalances, and their accumulation in balance sheet stock disequlibria, are left out of the conventional IS representation.After the past two decades, we should all be able to agree these are things that do matter to economic outcomes, and they cannot be left aside.As Minsky details in his book on Keynes, the rich interactions between finance and the economy apparent in the Treatise on Money and to a lesser extent the General Theory is suppressed or at best dwarfed in the Hicks/Samuelson neoclassical synthesis of Keynes that subsequently swept the profession. I can send you a copy if you wish.In addition, the financial balance diagram brings us one step closer to a clear representation of a stock/flow coherent macroeconomics. It thereby minimizes the tendency to slip into fallacies of composition, which so plague contemporary macro thinking (since it is really microeconomic aggregated to look like macro).For example, if you try to make the point that the the private sector cannot net save unless the government sector deficit spends, you will find most of your profession will look at you cross-eyed. Using the financial balance diagram, rather than IS, and such things become obvious. So the FB diagram imposes a consistency in thinking about macro which otherwise escapes most economists, investors, policy makers, financial and economic media, etc.If it would help, I could show you one way to bridge from the FB diagram to an IS schedule using asset prices rather interest rates on the vertical axis. I am in Vancouver next week presenting at a business conference, but could stop by soon thereafter, as I live in Berkeley.best, Rob

  7. I agree with the comment posted under Brad DeLong’s name above, at least from a pure accounting perspective. It’s parallel to the point I tried to make in the sector financial balances post that follows this one.There seems to be an accounting emphasis in the rationale for the transformation to the sector financial balances model. That’s ironic to me. I appreciate the importance of accounting, and as a result I can’t fathom why the two models aren’t completely reconcilable as a result of it.

  8. Cynical -Try this one on for size, might offer some new economic perspectives on questions of long term fiscal deficit spending. It is a Public Policy Brief at the Levy Economics Institute from earlier this year that directly addresses some of your concerns.http://www.levy.org/vdoc.aspx?docid=1119Also, take a look at Evsey Domar's 1944 AER journal article, "The Burden of the National Debt…"

  9. "Government spending becomes someone's income – who could that be? What does it do to your denominator GDP, especially if the recipient of that income spends it on other goods and services?" Zimbabwe has 241% public debt to GDP, Japan 170%,what good is running a deficit if it results in an hyper inflationary or stagnant economy? On the other hand, I like America to be prosperous nation, so I suggest that the government print a $100 000 dollars checks(actually make that a million/billion/trillion a pop since it doesn't matter and govt can always afford to run a deficit) and send them out to every individual- US citizen. Can you imagine the economic boom that follows? The economy is saved…by spending!"Interest expense on the public debt gets paid to someone – who could that be?"Last time I checked it was China, Japan, The Oil exporters and All others were at the bottom of the table "Finally, households and nonbank businesses cannot create money – that is counterfeiting. Where do you think they get the money from in the first place to pay taxes and buy Treasury debt?"How much money can the government create before it is too much? If the govt doesn't run deficit it will not need to "give" money to someone to buy their Treasury debt or to finance the deficit by taxing the same people it runs the deficit for!Already have read http://www.levy.org/vdoc.aspx?docid=1119 3-4 months ago. Do not agree with it!Big names have written it, but doesn't make it right(just my opinion).May I recommend (for your amusement)readings from the Austrian School of Economics

  10. Dear JKH and Cynical,JKH . . I would echo Rob's points here, which are much the same (though far more eloquently stated, as usual) as my response to you on the other post. Also, yes, accounting is part of it, since the vast majority of the profession haven't demonstrated they can do it. Witness reserve accounting or bank loans/deposits/reserves/capital. But that's not all of it, as we've explained in our replies here and in these posts.Cynical . . . Rob's suggestions are good ones. I'd add Jamie Galbraith's post here a few weeks ago titled "fiscal sustainability" and a piece I did a few years ago at http://www.cfeps.org ("interest rates and fiscal sustainability").In short, there are two issues. First, the long run deficit projections are due almost entirely to excess growth in health care costs. Fix health care, and you fix the problem. Even the CBO report you cite explains this in a later chapter. Second, the concept of fiscal sustainability relies on an assumption that the growth rate of GDP will be lower than the interest rate on the national debt (explained most famously in the Domar paper Rob cited, and the CBO paper assumes this, for instance). But interest on the national debt is a policy variable in a flexible exchange rate monetary system such as ours, not set by markets as most assume. And, in fact, aside from the 1979-2000 period during which the Fed set its target rate historically high as it moved to an inflation targeting regime, the interest rate on the national debt has actually been lower than the growth in GDP (I show this in the paper I mentioned above).Best,Scott

  11. I like what Rob wrote very much.In fact, though, they are reconcilable. But that's not the point.The important point, as Rob says, is that IS "conceals more than it reveals".As someone with considerable experience analyzing balance sheets and financial flows, I find IS/LM to be an intuitive abomination.

  12. Dear JKHAgree completely . . . they may be reconcilable (I can envision it, at least, which is I'm guessing what brought Brad's comment), but "intuitive abomination" is an apt characterization of IS (and IS-LM, for that matter), in my opinion.Best,Scott

  13. Cynical – Am quite familiar with the Austrian School, and I do find some useful insights in their body of work.I dealt with the hyperinflation risk in a recent Richebacher Letter. Kurt Richebacher integrated many Austrian insights into his own thinking. You may want to take a look at it.If the Japanese had understood Krugman's Cross, they may have avoided a lost decade or two. One can argue there is a path dependency or hysterisis that can creep in if an upward shift of the PSFB schedule is not addressed swiftly and sufficiently by a GFB schedule shift response.As for handing out money for free, I find an ELR approach a much better response when private market responses fall short enough of full employment that a debt deflation spiral is set off. I understand the Austrian view that we should just let such financial tornados level everything in their path unabated and start over again. I find that somewhat unrealistic though.

  14. An interactive version of Krugman's cross diagram, along with a nod to Economic Perspectives from Kansas City, is available through the Wolfram Demonstrations Project at http://demonstrations.wolfram.com/AutomaticStabilizersInKrugmansCrossDiagram/

  15. Pingback: Krugman’s New Cross Confirms It: Job Guarantee Policies Are Needed as Macroeconomic Stabilizers | | New Economic PerspectivesNew Economic Perspectives

  16. Pingback: MMT, The Euro and The Greatest Prediction of the Last 20 Years | | New Economic PerspectivesNew Economic Perspectives

  17. It’s nice to say Krugman saying stating a fact and interpreting it in the correct way, instead of whining about MMT and MMTers. But turning one’s cloak is so effortless these days. Therefore, I’ll remain circumspect about Krugman.
    I would like to point out the fact that “magical” mathematics have infested not only economics, but physics as well. The fact that theoretical physics are exploring 10 or 12 dimensional universe models is just plain delusional. One of the most tragic myths created by pseudoscience is the idea of time travel.
    First of all, there’s no such thing as time. We made it up. George Carlin pointed out this early in his stand-up career. In fact, if one reads Zeno’s paradoxes, he will understand this as well. Time is nothing more than a necessary abstraction. It’s what we use to measure activity/motion. (the movement of an object from point A to point B)
    Time does not exist independently of action. More so, mathematicians have created and indoctrinated the people to believe that space is curved. Folks, space cannot have kinetic, structural, or angular properties, else it’s not space, but a medium – like air is for sound. To paraphrase Nikolai Tesla, just because gravity curves matter, to say that gravity bends space is like saying that something can have an effect upon nothing.
    What physicist who are fraudsters do, when they can’t explain physical reality? They try to impose arbitrary magical mathematics upon the physical reality. So they invent 3 more, 6 more etc dimensions just to make their own brand of mathematics work. Anyone of us can make a theory where 2 plus 2 equals 5, and it can have mathematical logic inside that theorem, but that doesn’t mean that physical reality will respond to our delusions.
    This is similar with the entropy worshipers. What does a fraud to in order to make his “work” seem more sophisticated? He applies the word entropy to it.
    At this point, people don’t even understand what heat is, because of all the bs spewed by the corrupt academic establishment. Heat is molecular motion. What is entropy? Uniform dissipation of heat. Entropy works “by the book” in closed systems, but not in open systems. And the ironic thing is, that in order to actually obtain the entropic effect, one needs an antientropic effect prior to heat dissipating itself. One needs a centralization of heat, or spark, before that heats gets to flow outward. And besides, entropy is the minor force in the equation. Gravity, nuclear forces, electromagnetism, these forces are much more powerful than entropy.
    Considering the research done by some of the great minds of history, from Francesco Redi, to Pierre Curie, Louis Pasteur, Alexander Gurwitsch, Vladimir Vernadsky, Fritz Popp and many others, life is an antientropic force. And the noosphere, the sphere of human ideas (creative reason) is shaping the biosphere (including the geosphere), creating new/higher forms of organization. And the noosphere does it at fundamentally distinct and higher qualitative level, compared to animals, which don’t possess creative reason, nor the necessary morphology to willfully manipulate their surroundings, and constantly change the relation between them and the environment. Humans changed their relation with nature at a fundamental molecular level, via the discovery and use of fire.