
By Eric Tymoigne
The US financial system is extremely complicated and this series shades light only on some corners of that system by focusing on the banking sector. Here is a broad picture of the US financial system (some things have changed since the last time I made this). Since the beginning of this M&B series, posts have emphasized the importance of balance sheet to get a solid understanding the mechanics at play in the financial sector. This post continues that trend.
The balance sheet of a bank
The balance sheet of a private commercial bank looks like this:

Promissory notes issued by others include any kind of agreement between the bank and an entity that promised to pay some monetary amount(s). That entity can be a domestic or foreign, household (mortgage note or any other customer notes), company (business credit, corporate securities), or government (treasuries, municipals). Promissory notes may or may not have a market in which they can be traded. If they have a market they are called “securities”, if they do not they are called “loans and leases” (Post 2 and Post 10 explain that the word “loan” is really inappropriate). Post 3 studied in details reserves, which are themselves a promissory note as explained in Post 15, but are singled out for analytical purpose. Non-financial assets include real estate, computers, goodwill etc.
Promissory notes issued by the bank include checking accounts, savings accounts and other transaction accounts. They also include other liabilities such as certificates of deposits (CDs), bonds and other securities issued by the bank. One may choose to include shares here or in net worth, for our purpose it is not that important.
As usual, net worth is the residual item and its main role, as explained in Post 2, is to protect the creditors of the bank, i.e. those who holds the promissory notes issued by the bank (you and I for the accounts, CD holders, etc.).
Figures 1 and 2 show how the composition financial assets and liabilities of US banks has changed since 1945 (amount of non-financial assets is not available). After WWII, banks were stuffed with treasuries and reserves that represented about 75% of their assets. A switch occurred progressively toward private-issued notes and municipals as banks turned their business activity toward supporting the growth of the economy instead of the war effort. Today, percentage-wise, treasuries and reserves are a marginal items in the assets of banks.
Bank accounts (“deposits”) are still the main liability of commercial banks but the structure of accounts changed with checking accounts representing about 10% of liabilities in 2010 versus 75% after WWII. Time and savings accounts have grown in proportion and they represented about 55% of the liabilities of banks in 2010. Figure 2 also clearly shows the rise of the federal fund market from the 1960s. Figure 2 does not show interbank lending debt given that it is the balance sheet of banks. Indeed, if bank X owes to bank Y, when they are put together in one balance sheet the consolidation removes debt owed to each other. Data about federal funds and repurchase agreements (RPs) are liabilities with other participants of the federal funds market.
Figure 3 shows how the predominance of “depository institutions” (commercial banks and thrifts) in the financial sector has changed through time. From 1980 until 2000, the share of financial assets held by banks fell dramatically from 60%. Instead, money managers (mutual funds, pension funds, etc.) have gained in importance as did financial institutions related to securitization (GSE, Asset-backed security issuers, etc.) that together held about 55% of the financial assets held by the financial industry in 2010. Within the financial industry, banks now hold about 30% of the financial assets held by the financial sector, which has been a stable proportion since 2000.
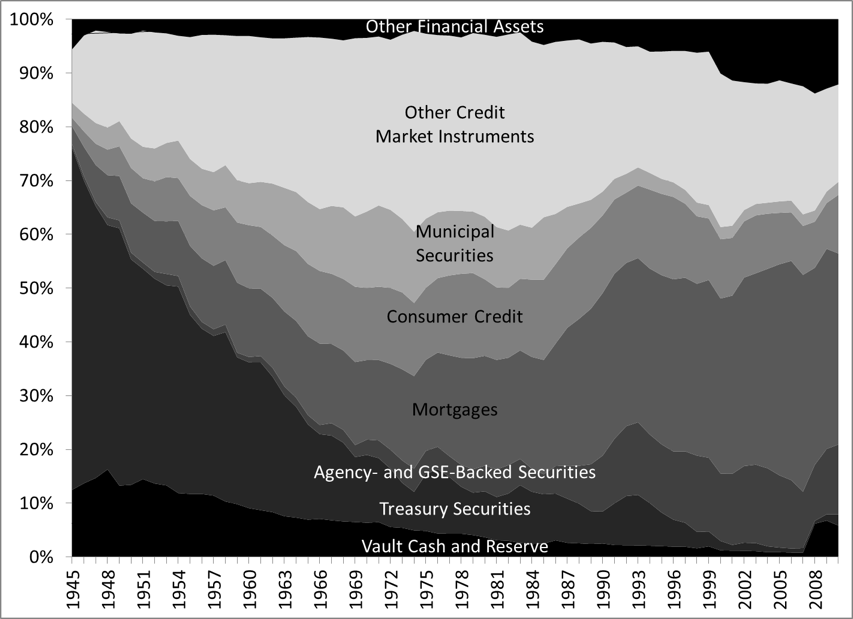
Figure 1. Composition of Financial Assets of US-Chartered Commercial Banks
Source: Board of Governors of the Federal Reserve System (series Z.1)
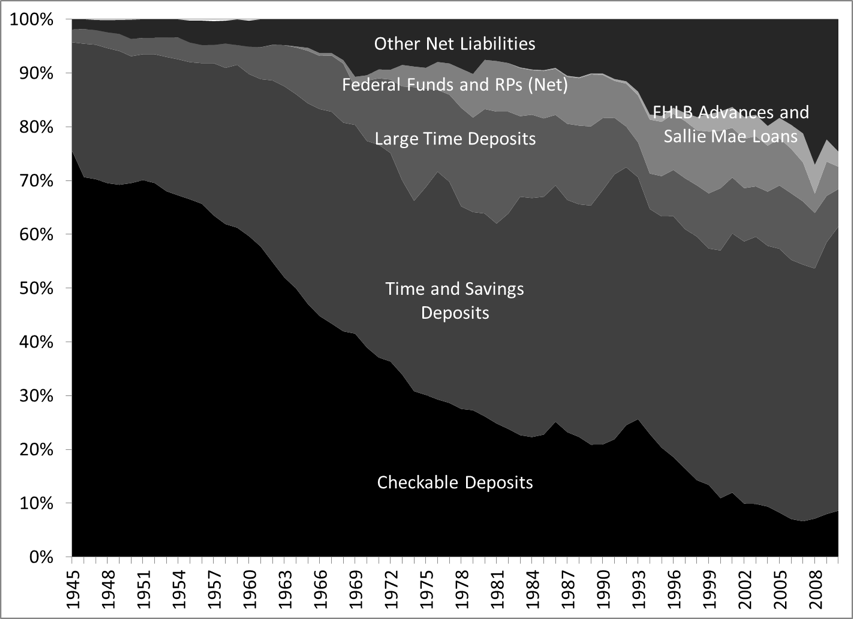
Figure 2. Liabilities of US-Chartered Commercial Bank, Proportion
Source: Board of Governors of the Federal Reserve System (series Z.1)
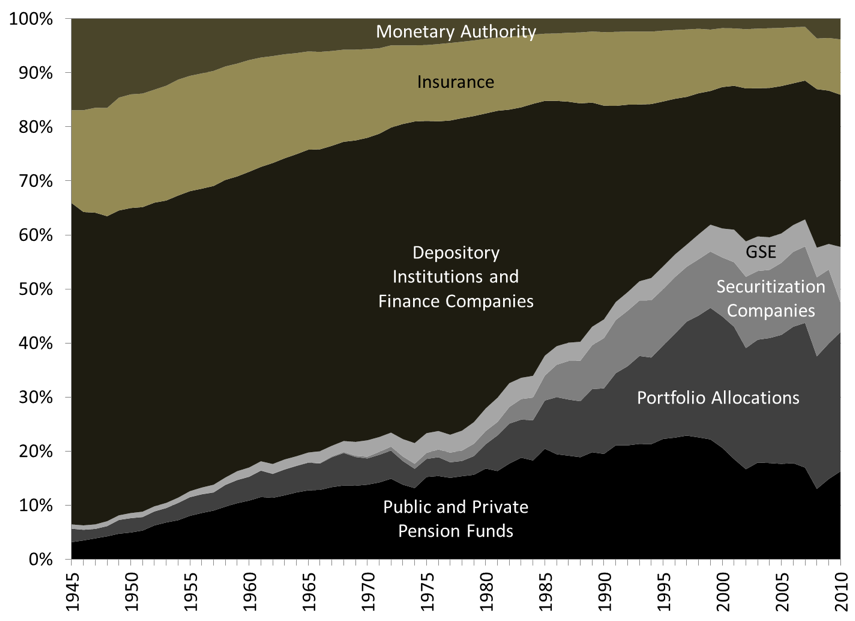
Figure 3. Allocation of Financial Assets within the Financial Sector
Source: Board of Governors of the Federal Reserve System (series Z.1)
What do banks do?
The previous balance sheet hints that banks are involved in many crucial activities including:
- Credit services: Swapping promissory notes to allow liquidity, credit risk, and maturity transformation
- Payment services: Transferring funds between bank accounts
- Retail portfolio services: Providing income-earning opportunities for small entities with excess monetary balances and providing cash at will.
A central aspect of the balance sheet of banks is that the promissory notes issued by banks have a shorter term to maturity than the promissory notes on their asset side. Banks are involved in “maturity transformation.” They accept promissory notes from their customers for which the principal will not be repaid for a long time. In exchange, they give to their customers some promissory notes that are due relatively quickly. Checking accounts are due at the demand of their bearers and CDs come due at most in a few years, whereas the principal on mortgage notes will be fully repaid in decades.
A central implication of maturity transformation is that banks have an inherent need for a stable refinancing source because they must fund long-term positions in assets with short-term liabilities. To limit the refinancing risk (that was exemplified with households in Post 7) that comes with this balance-sheet structure, a central bank that provides stable low-cost refinancing channels is crucial.
Some of the promissory notes that banks issue has another other interesting property for potential clients. Post 15 explains that their financial characteristics are such that if they ought to trade at par if they do not carry any credit risk. Transfer between bank accounts is done at par, conversion into Federal Reserve note is done at par, and in case of default FDIC guarantees the funds in bank accounts. The main takeaway is that banks provide to their customers a reliable means of payments that is widely accepted. On the contrary, the promissory notes issued by clients are not widely accepted so making payments with them is difficult if not impossible.
What makes a bank profitable?
Like any other for-profit business, a bank operates to meet its profitability target while being constantly on the look-out to maintain its liquidity and solvency (at least it is the hope! When banks are run by fraudsters or are focused on short-term results, concerns about liquidity and solvency go out of the window). The profit of a bank depends on the following components:
Profit of a bank = Net capital gains + Net interest income + Other incomes – Other expenses than interest payments
Net capital gains is the difference between capital gains and capital losses. This net change can be positive (net capital gain) or negative (net capital loss). Net interest income (aka net interest margin) is the difference between interest earned on bank assets and interest paid on bank liabilities. Other incomes include fees and other charges imposed on customers. Net interest income is the biggest source of income for banks but its proportion in bank income has declined since the early 1980s for reasons explained in the last section. In 2014, net interest income represented about 60% of the income earned by banks compared to 80% from about the mid 1940s to the early 1980s (Figure 4). Net interest income is the lowest proportion of profit for the largest banks.
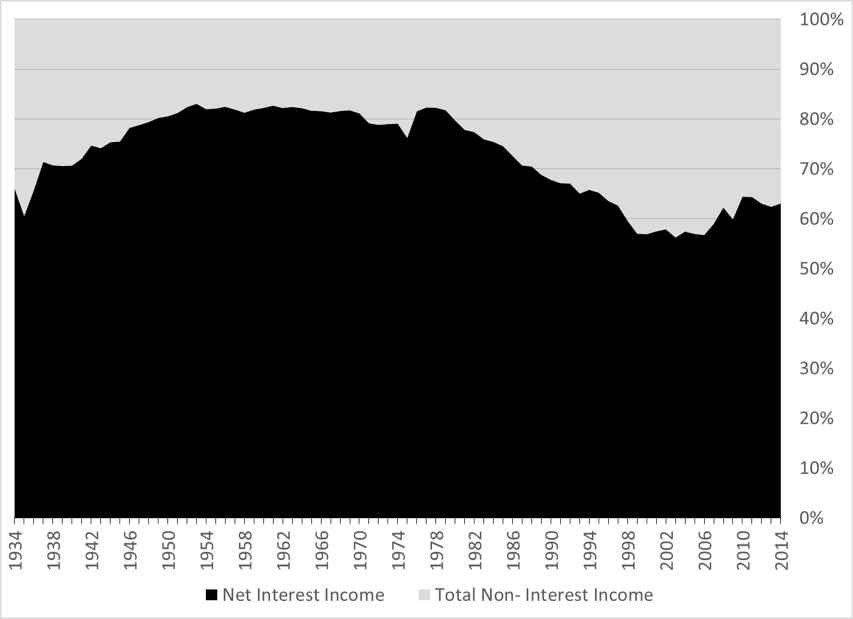
Figure 4. Sources of Income of FDIC-Insured Banks.
Source: FDIC Annual Financial Data
Banks, however, are not interested in monetary profit per se. Instead, a key measure of profitability is the return on equity (ROE), the ratio of monetary profit over net worth. Post 7 explains that this ratio can be decomposed into the return on assets (ROA) and leverage (Figure 5). ROE and ROA averaged 9.7% and 0.84% respectively from 1984 to 2014. The ROA of the largest banks is more volatile than others without being higher on average (Figure 6). The larger the bank, the higher the leverage (Figure 7), but balance-sheet leverage has mostly fallen through time and Tier-1 leverage has converged toward 9 for all banks, 11 for the biggest banks, 8 for the smallest.
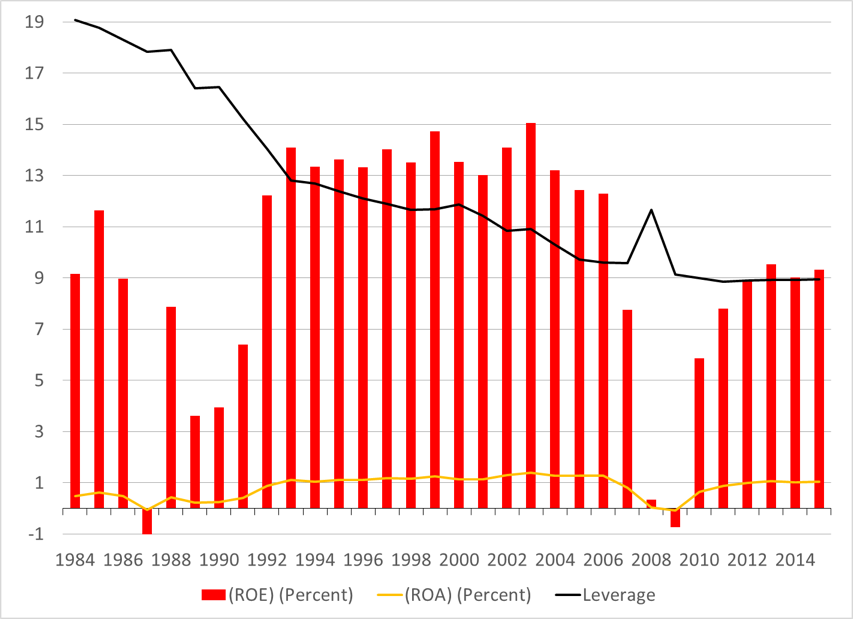
Figure 5. ROA, ROE, Leverage of all FDIC-insured institutions
Source: FDIC Graph Book

Figure 6. Annual Return on Assets
Source: FDIC Aggregate Time Series Data
Note: Banks with over $10 billion in assets represent about 10% of the industry (595 institutions). Most institutions (62% or 3800 institutions) are between $100 and $1 billion.
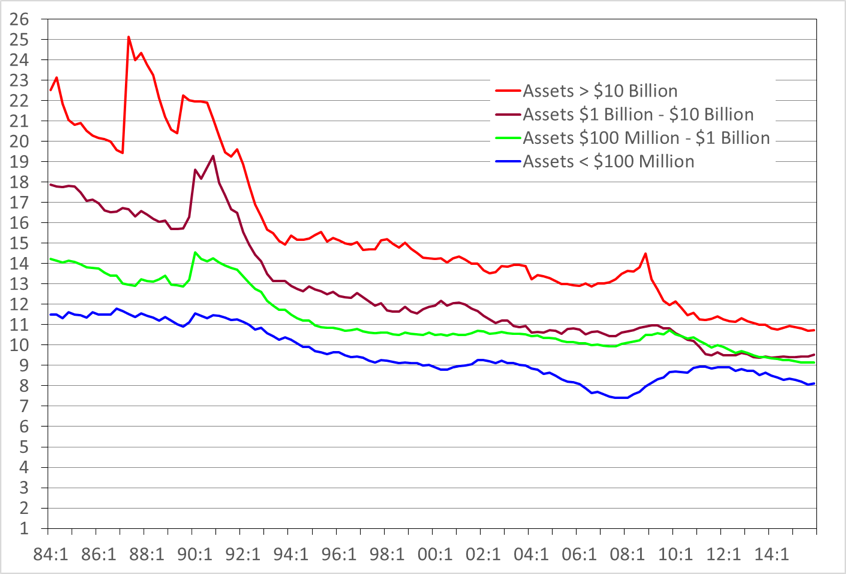
Figure 7. Tier-1 Leverage (Inverse of Tier 1 leverage capital ratio)
Source: FDIC Aggregate Time Series Data
Note: Tier-1 capital is a component of capital.
Banks have a ROE target (among other targets) in mind to which bonuses of employees are related (if a bank reaches or passes the target, employees can expect a good bonus). Bank employees have two means to reach the target if ROE is falling away from it: raise ROA or/and increase leverage.
Raising ROA means charging a higher interest rate on customers’ notes (higher mortgage rate, higher consumer credit rate, etc.), charging more fees, buying higher-yield securities, trading securities more aggressively to make bigger capital gains, and/or reducing expenses. Given expenses, all this means taking more credit risk and market risk, because raising ROA implies catering to less creditworthy economic units or being involved in more volatile trading strategies.
Raising leverage means increasing the size of liabilities relative to net worth. Post 7 explores the concept of leverage more carefully in terms of its advantages and risks. Post 9 explains that banks are limited at a point in time in their ability to leverage by regulation, but they always “innovate” overtime to bypass regulations.
Risks on the bank balance sheet
The profitability of a bank critically depends on the following:
- The ROA which depends on:
- Creditworthiness of the issuers of promissory notes (credit risk): households, businesses, and government may not be able to service their promissory note, which means that a bank does not receive its expected income and instead records a loss.
- Actual and expected market value of securities (market risk): capital gain and losses are recorded on a daily basis for some assets.
- The cost of funding the banking business (refinancing risks induced by interest-rate risk, maturity mismatch risk): cost of acquiring reserves and cost of holding accounts (i.e. giving incentive to account holders not to withdraw their funds in order to avoid having to borrow reserves or to sell interest-earning assets to get reserves). If the Fed raises FFR quickly, banks that have fixed-rate long-term assets see their net interest income dwindle quickly.
Creditworthiness, capital gains and losses, and bank-funding costs are influenced by the state of the economy, expected interest rates, future monetary and fiscal policies and many other factors. For example, if it is expected that economic activity will slowdown, then one may expect that layoffs will rise and so that some debtors will have problem to service their debts. Post 4 explains how expected monetary policy impacts current asset prices.
This means that, to run a banking business properly, a banker must make expectations about a whole range of factors. Of course, these expectations usually turn out to be incorrect. When expectations are under-optimistic, bankers are pleasantly surprised and may double-down on the risks they take. When expectations are over-optimistic, things can turn sour very quickly if credit analysis was not done properly, if capital, liquidity, and loss-reserve buffers are inadequate, if fraud has been prevalent.
Figure 8 shows the impact of credit and market risks. The value of promissory notes falls as economic units default or the value of securities falls. This impacts net worth and so the ability to meet the capital requirements presented in Post 9 (in the example a 15% loss on promissory notes leads to a decline in the capital ratio from 20% to 5%). If a bank is unable to meet its capital requirements, regulators may demand that the bank be closed.
Figure 9 shows the amount of non-tradable promissory notes that were past due by at least 30 days relative to the amount of tier-1 capital and loan-loss reserves. Loan-loss reserves are not the same thing as reserves, they are extra capital that banks keep to buffer against expected losses on the non-tradable promissory notes of their clients. In general, the larger the banks the worst the performance, that is, the larger the bank, the higher the proportion of past due loans.
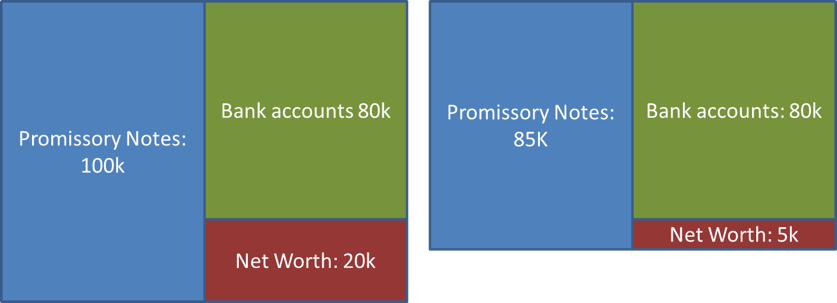
Figure 8. Impact of default and/or capital losses
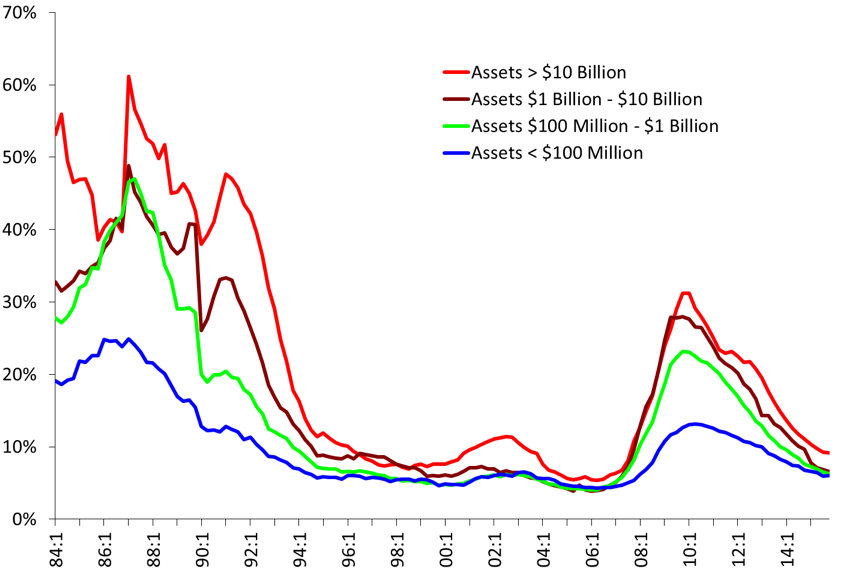
Figure 9. Noncurrent Loans & Leases as a Percent of Tier 1 Capital plus Loan-Loss Reserves
Source: FDIC Aggregate Time Series Data
Banking on the Future
A study of the profitability of banks clearly shows that this business is all about “banking on the future.” There is a myriad of future economic events that influences the assets and liabilities of banks and so how profitable, solvent and liquid banks are. In terms of assets, the role of banks is to judge and validate (or not) the expectations that are brought to the table by their clients. As the saying goes in the banking industry, “I’ve never seen a pro forma I didn’t like.” Economic units that want to go into debt with a bank always present a very favorable view of their project and future economic prospects. The role of bankers ought to be to tame that vision of the future into a more realistic view, in the sense that the view conforms more closely to past economic trends and past history of probable success.
Bankers are supposed to do this by requesting documents that provide evidence that an economic unit will be able to fulfill the requirement of the promissory note (usually pay interest and principal due on time), and by requesting some guarantees in terms of covenants (e.g., ability to check how a business is run or ability to influence business management if needed) and collateral (ability to seize assets held by the economic unit in case of default). Bankers are then supposed to check this information against a given set of standards that defines what a creditworthy economic unit is. Such standards include among others:
- The debt-service to income ratio: what is a sustainable amount of interest and principal payment relative to the income earned? 20%, 30%, 40%?
- The amount of monetary balances relative to the amount of debt: what is a sustainable amount of liquid savings that an economic unit should have relative to an amount of debt? 10%, 50%, 60%?
- The loan-to-value ratio: What is the maximum amount of credit a customer can ask relative to the value of a collateral to be deemed creditworthy? Is it ok to have a mortgage that represents 50% of the house value, 80%, 100%?
In practice, given that the future is uncertain and given the elastic nature of the standards used, assessing creditworthiness is not always easy. In addition, banking is a competitive sector so assessing creditworthiness is influenced, not only by the need to check carefully ability to pay, but also by the need to maintain and grow market shares. If a TV maker has sold all the black-white TVs that could be sold, the next step is not to close shop or to rely only on repairs and replacements. The next step is to invent color-TVs, flat-screen TVs, 3D-TVs, etc. so that consumers have an incentive to ditch their old TVs and by new ones. The same dynamics are at play in banking. Maintaining market share may require to “innovate”:
- By pushing existing and new clients into new “low cost” products. A typical example of that was the mid-2000s when clients were incentivize to go into interest-only mortgages, pay-option mortgages, cash-out refinance mortgages, home-equity advances.
- By incentivizing existing clients to go further into debt or to refinance. A typical example of that is the 2001 refinancing wave of prime mortgagors when they refinance into fixed-rate mortgages with lower rate
- By loosening credit standards when the pool of what is deemed a creditworthy client is shrinking and new business opportunities must be sought to maintain ROE. After the 2001 refinancing wave among prime households, banks turned toward non-prime households for new business opportunities.
Thus, overtime credit standards may loosen. When previously one had to have a debt-service to income ratio of at most 30% to be considered creditworthy, now banks are ok with 40%. The mortgage boom of the mid-2000s broke all standards of creditworthiness, with bankers willing to provide high-interest-rate mortgages to customers with no proof of income, job or assets (the infamous “NINJA loans”) in an amount that represented over 100% of the value of a house. Even prisoners could get a mortgage. The only way to make that type of mortgage profitable was to resale the house at a price high enough to cover the repayment of all the principal and interest due. This implies finding another person willing to go into debt to buy the house at this higher price. A typical Ponzi game was at play.
Some bank managers thought that “the whole system was based on raping the public” and refused to lower their credit standards; but, this came at the cost of accepting a massive loss of market share. Most bankers, especially on Wall Street, cannot accept such a decline; in fact they cannot even accept stable market shares, as Mr. Blankfein noted:
It should be clear that self-regulation has its limits. We rationalised and justified the downward pricing of risk on the grounds that it was different. We did so because our self-interest in preserving and expending our market share, as competitors, sometimes blinds us—especially when exuberance is at its peak. (Blankfein 2009)
Wall-street financial institutions are growth-oriented businesses and so must find ways to constantly expand their business. The loosening of credit standards will occur all the faster that the banking structure is such that it reward bankers based on the volume of promissory notes accepted instead of the quality of promissory notes. As explained below, the banking industry has moved in that direction since the 1980s at least.
This pressure to loosen credit standards has been illustrated neatly quite a few times. For example Wojnilower noted in 1977:
In the 1960s, commercial bank clients frequently inquired how far they could prudently go in breaching traditional standards of liquidity and capitalization that were clearly obsolescent. My advice was always the same—to stick with the majority. Anyone out front risked drawing the lightning of the Federal Reserve or other regulatory retribution. Anyone who lagged behind would lose their market share. But those in the middle had safety in numbers; they could not all be punished, for fear of the repercussion of the economy as a whole. […] And if the problem grew too big for the Federal Reserve and the banking system were swamped, well then the world would be at an end anyhow and even the most cautious of banks would likely be dragged down with the rest. (Wojnilower 1977, 235-236)
John Maynard Keynes noted more than eighty years ago while talking about financial-market participants: “Worldly wisdom teaches that it is better for reputation to fail conventionally than to succeed unconventionally.”
Evolution of Banking since the 1980s
The promotion of competition and short-run rewards, together with the lack of regulatory enforcement (see Post 9) and a monetary policy focused on fine-tuning the economy, have pushed banks to move away from a business model that promotes careful underwriting (i.e. determination of creditworthiness) and toward market-share growth. Figure 4 gives a hint of that trend. This banking system is more unstable because it promotes an increase the size of leverage (indebtedness is bigger) and a decline in the quality of leverage (more dangerous financial products, less guarantees, less verification).
Within banks, there are two important desks, the loan-officer desk (whose task is to judge the quality of the projects proposed by potential clients and to tame optimism) and the position-making desk (whose task is to finance and to refinance the asset positions taken by the bank). In the originate-and-hold banking model, the point of a bank is to establish long-term relationships with clients based on trust and recurring credit agreements, and to make a profit based on the net interest margin. A bank carefully checks the 3Cs of credit analysis: cash flow, collateral, and character. Think of George Bailey in It’s a Wonderful Life as the stereotypical banker of this type of banking model: he knows his neighborhood well and does business there, he knows most of his clients personally, he keeps his clients’ promissory notes in the bank vault, he makes a profit by waiting patiently that debts be serviced, if a client has a problem they sit down and try to work it out given that George’s success depends on his client’s success.
This form of banking always exists at any point in time (that is what banking is after all), but it thrived after the Great Depression when competition in the financial industry was reduced and the central bank kept its refinancing cost stable and low. With increased competition from other financial institutions and changes in the monetary policy practices of the Fed, this banking model became less viable as the interest-rate risk became too great. Post 5 shows that the Volcker experiment led to a very large increase in the level and volatility of the federal funds rate. This occurred at a time when banks had a lot of fixed-rate long-term assets on their balance sheet (think mortgages) so their net interest margin shrank. This is all the more so that rising short-term rate pushed banks to raise the rate on their savings accounts. Regulation Q (a Fed regulation regarding the maximum interest rate that savings account and certificates of deposit could carry) limited banks’ ability to do so and so lots of people removed funds from their savings accounts and put them into more lucrative, but still liquid, financial instruments. Regulation Q was relaxed as FFR rose and ultimately abandoned.
Banks pushed for—and obtained—a deregulation of their business to allow them to diversify the assets they could buy and to allow them to provide more attractive rates on their liabilities. This ultimately led to the savings and loan (S&L) crisis when savings and loan institutions (banks that specialized in holding mortgage notes) were hit by massive credit risk. From the early 1980s, they had taken positions in more risky assets to offset the higher cost of their liabilities induced by the Volker experiment, and widespread fraud by top bank managers followed deregulation. Other banks were not immune from the crisis and also recorded large default (Figure 9). The S&L crisis marks the end of the originate-and-hold banking model.
This model has now been replaced by an originate-and-distribute banking model. Profit-making activities have been shifted toward the position-making desk. While net interest margin is still a significant source of profit for banks, its importance has diminished substantially (Figure 4). Banks no longer look for a long-term individualized relationship with recurring borrowers; the relation is impersonal and judged in minutes through a credit-scoring method. Promissory notes of customers are packaged and sold to special purpose entities that fund the purchase by issuing bonds (mortgage-backed securities, collateralized debt obligations, etc.). Banks make money from the fees that come from passing the debt service to the SPEs, and have been more involved in trading activities, especially top banks that currently get between 6% and 9% of their gross revenue from trading (Figure 10).
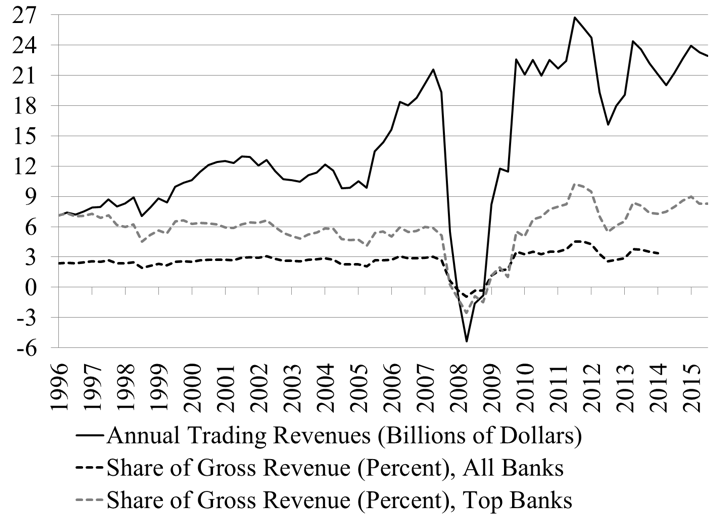
Figure 10. Trading revenues from cash and derivative positions
Source: OCC Quarterly Report on Bank Derivatives Activities
Note: Data discontinued for all banks as of Q2 2014
Note: The size and composition of “Top Banks” vary through time. Currently there are four top banks: JP Morgan Chase, Bank of America, Citibank, and Goldman Sachs.
Done for Today! Next post focuses on the regulation of the banking industry.
[Revised 8/2/2016]


6 responses to “Money and Banking-Part 8: The Private Banking Business”