
By Eric Tymoigne
Given that the concept of leverage will be used often in the upcoming posts, this post spends some time explaining what leverage is and some of its impacts on the balance sheet of any economic unit.
What is Leverage?
Leverage is the ability to acquire assets in an amount that is larger than what one’s own capital allows to buy. Say that an economic unit has a net worth of $100, that it has no debt and that the counterparty is $100 in cash (Figure 1). The balance sheet looks like this:
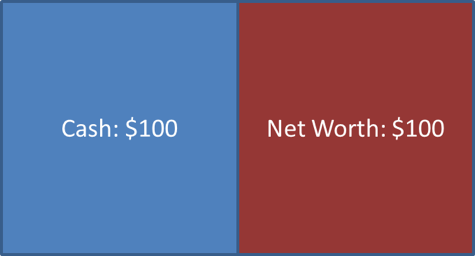
Figure 1. A balance sheet without leverage
What is the leverage? Leverage = asset/net worth = asset/equity = A/E = $100/$100 = 1. No debt used, all the cash the economic unit has was acquired without the help of any debt (e.g., grandpa gave $100 for Christmas, or you worked to get $100). Now the economic unit decides to use its cash to buy a bond that pays 10% yearly.
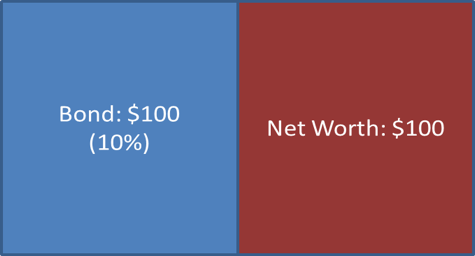
Figure 2. Another balance sheet without leverage
What is the leverage? Leverage = A/E = $100/$100 = 1. Still no leverage but this balance sheet allows the economic unit earns interest income: Cash inflow = $10 yearly as interest payment. Of course, buying a bond involves additional risks than cash:
- Default risk (the bond issuer does not pay the $10 interest and cannot repay part or all the principal due)
- Market risk (the market value of the bond declines and one might have to sell it for less than what one paid for it)
Going back to case 1, now the economic unit decides to get a $900 credit from a bank at 1% and to buy 10 bonds that pay 10%:
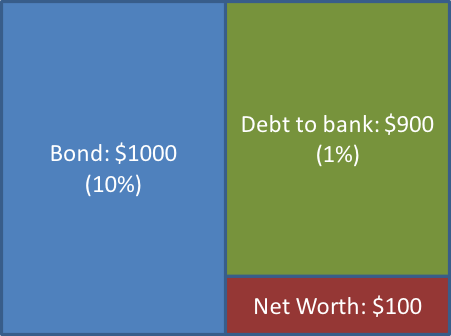
Figure 3. A balance sheet with 10x leverage
What is the leverage? Leverage = A/E = $1000/$100 = 10. The economic unit has acquired 10 times more assets than what its capital (its own money) allows to buy. It did so by going into debt.
This example is the simplest form of leverage. They are many ways to introduce leverage in a financial deal. Some of that leverage does not have to be reflected in the balance sheet in the form on a debt to someone. As long as one can acquire an asset by paying upfront only a fraction of the value of that asset, there is some leverage.
What are the advantages of leverage?
A key metric of profitability is the return on equity (ROE). This return is the ratio of profit over equity. The ROE can be decomposed has followed:
Profit/Net worth = (Profit/Assets)*(Assets/Net worth)
ROE = ROA * Leverage
Return on Assets (ROA) measures the earning power of the assets on a balance sheet, ROE measures how successfully an economic unit used its own capital. Leverage multiplies the impact of ROA on ROE because it allows to acquire more assets without having to pay the full amount due with one’s own funds. Thus leverage gives the following advantages:
- Better nominal return:
- No leverage: income = net income = $10
- 10x leverage: income = 10 x $10 = $100, Net income = $100 – $9 = $91 > $10
- Better return
- Return on Asset (ROA)
- No leverage: interest/bond = $10/$100 = 10%
- 10x leverage: net interest/bond = ($100 – $9)/$1000 = 9.1%
- Return on equity (ROE)
- No leverage: interest/equity = $10/$100 = 10% = ROA
- 10x leverage: net interest/equity = ($100 – $9)/$100 = $91/$100 = 91%
By leveraging 10x, ROE is 10 times higher than ROA (9.1% vs 91%) simply from the fact that one could acquire ten times more assets.
What are the disadvantages of leverage?
Interest-rate risk
What if the interest rate on bank debt goes up to 12% in the previous example?
- No leverage: cash outflow = $0 => net cash flow = $10
- 10x leverage: cash outflow = $900 x .12 = $108 => net cash flow = -$8.
This risk is especially high if an economic unit went into debt on a short-term basis for a long-term portfolio strategy. Assume one plans to hold 10 bonds for 2 years but issued debt with a 6-month term to maturity, then one needs to refinance (i.e. repay the debt and ask for credit again) three times.
But there are more worries because economics units care much more about ROE than dollar gains. In this case, ROE losses are also multiplied by the size of the leverage.
- No leverage: ROA = ROE = 10%
- 10x leverage: ROA = -$8/$1000 = -0.8%
- 10x leverage: ROE = -$8/$100 = -8%
Higher Sensitivity of Capital to Credit and Market Risks
The same percentage decline in the value of bonds (due to default or loss of market value) leads to much bigger decline in equity (Figure 4).
- No leverage: A 10% decline in the value of the bond wipes out only 10% of net worth
- 10x leverage: A 10% decline in the value of bonds wipes 100% of net worth
Post 9 shows that banks can only tolerate a limited decline in the value of their assets. Indeed, not only are they highly leveraged, but also there are regulations governing the amount of capital they are required to have.
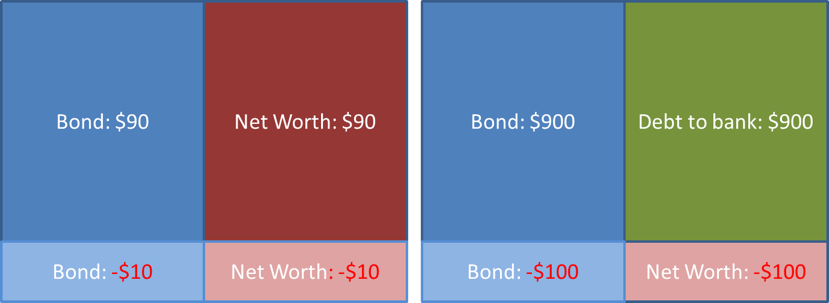
Figure 4. Impact on capital of a decline in the value of bonds under no leverage and 10x leverage
Refinancing Risk and Margin Calls
- Impact for mortgage debt:
Say that in 2006 a household wants to buy a house that costs $100k and that the bank states that one must provide a 20% down-payment. How much of the cost of the house is the bank willing to fund at the maximum?
0.8*100000 = $80000
Now, say that the value of the home goes down to $50000. Assuming the bank is still willing to provide up to 80% of the house value, the maximum the bank will provide is:
.8*50000 = $40000
For the same house, the bank is willing to provide less advance.
Table 1 shows three different contract structures with actual numbers when a household agrees to issue an $80k mortgage note:

Table 1. Mortgage notes with different terms
In the U.S. the traditional mortgage is a fixed-rate fully amortized (i.e. for which principal is repaid bit by bit every month) mortgage (case A). During the 2000s housing boom, a lot of prime and subprime households choose to issue interest-only mortgages (IOs) (case B). With an IO, a mortgagor can choose to pay only the interest due for a certain time period (say 10 years), and after that the principal must be repaid bit by bit. This means that for a period of time, case B is cheaper than case A.
The proportion of IO issued by non-prime households on a given year went from virtually 0% to 30% of mortgages issued by non-prime households. As the Fed started to raise interest rate in 2004, the proportion of pay-option mortgages issued non-prime households grew (pay-option mortgages allow to pay only part of the interest due) (Figure 5).
The selling point by mortgage brokers was that IO are cheaper to service for 10 years and that while it is true that one might not be able to make that additional $1264 payment that will come in 10 years, there is no need to worry because refinancing at better terms is always possible given that home prices always go up.
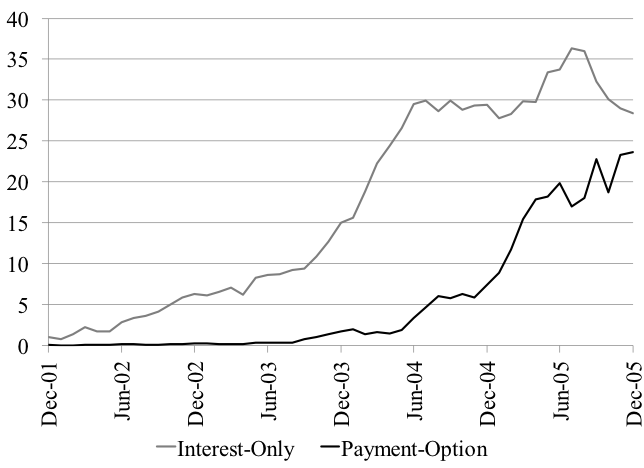
Figure 5 Share of Exotic Mortgages in Non-Prime Mortgage Originations, Percent.
Source: Federal Deposit Insurance Corporation (FDIC Outlook, Summer 2006).
Comes 2016 and the household can cannot make the additional $1264 payment. What can be done? Let us refinance by issuing an $80000 fixed-rate mortgage with better terms (option C) and by using the funds to repay the $80000 due on the IO mortgage. So the household goes to a bank with the intention to get a credit of $80000. Unfortunately, the bank states it can only provide $40000, i.e. it refuses to refinance unless the household can come up with $40000. Why? Because the home value is now $50000.
In times of crisis, the refinancing problem induced by the decline in the value of houses is actually reinforced by the fact that the loan-to-value ratio declines. So instead of granting an advance of up to 80% of the home value, now a bank will do only 60%, which means that the household can only get $30000 from the bank.
- Impact on security-based debt: Margin call risk
A broker allows an economic unit to have outstanding bonds 10 time as large as its equity. What if suddenly:
- The value of bonds declines: net worth declines => leverage is much higher than 10 => the broker demands additional collateral (and so net worth in the balance sheet) to restore a 10x leverage
- The broker increases the margin requirement (loan-to-value ratio declines), i.e. decide to lower the allowed leverage from 10 to 5. This is equivalent of saying that now in order to be able to get external funds to buy $1000 of bond one must put down $200 instead of $100.
Embedded leverage
Leverage comes in many forms and may not be directly observable in the balance sheet. In fact, financial institutions try to hide leverage as much as possible to circumvent regulation, and, in the worst cases, to confuse potential clients who are attracted by the high promised ROE.
A form of leverage that gained attention during the recent crisis is embedded leverage—or leverage on leverage. Figure 6 presents a “simple” case of embedded leverage.
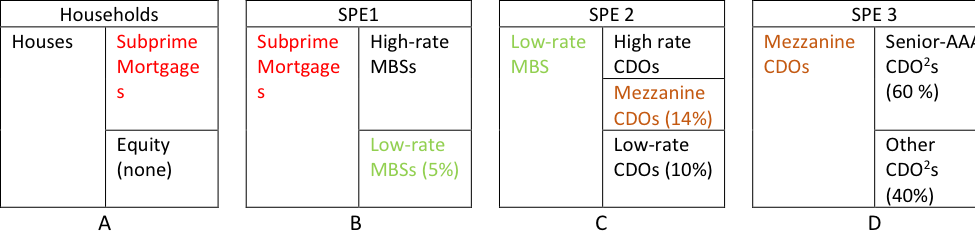
Figure 6. Financial layering or Embedded Leverage.
The following is going on in this picture:
- A bunch of households with poor creditworthiness issued mortgages to a bank to finance 100% of their houses ($100k house is financed by $100k mortgage) (balance sheet A)
- The bank did not want to keep the mortgages on its balance sheet so the bank created an SPE1 (special purpose entity 1) that purchased the mortgages. To finance the purchase, SPE1 issued bonds collateralized by the mortgages (mortgage-backed securities) of two different ratings, low and high, with low representing 5% of the issuance. The debt service received from subprime mortgages is used to service the MBSs (balance sheet B)
- Nobody wanted to buy the low-rate MBS so the bank created SPE2 to purchase them. SPE2 issued bonds backed by MBSs (collateralized debt obligations, CDOs). The debt service from low-rate MBSs is used to service CDOs (balance sheet C)
- Nobody wanted to buy the mezzanine CDOs that represent 14% of all the CDOs issued by SPE2. The bank created yet another SPE that bought the mezzanine CDOs by issuing bonds backed by them (CDO squared). AAA CDO2s are bought by pension funds, others are bought by hedge funds and others. The debt service from the mezzanine CDOs provides the cash flow necessary to service the CDO2s (Balance sheet D)
Taken in isolation, i.e. looking at SPE3 alone, AAA CDO2s seem very safe because the value of mezzanine CDOs must fall by 40% before the principal on the AAA CDO2s starts to be impacted (other CDO2s act as equity for AAA CDO2s). A pension fund that looks only at that deal does not even blink, AAA CDO2s provide higher yield than AAA corporate bonds; buy! Buy! buy!
Of course, the higher yield was achieved by the embedded leverage. Say that households starts to default, what is the default rate that makes AAA-CDO2 worthless?
- A 5% loss on the mortgages makes low-rate MBS worthless (they are the first to take the loss in this SPE structure), which makes SPE2 insolvent and so all CDOs worthless.
- CDO2 become worthless much faster. If the mezzanine CDOs are worthless then CDO2 are worthless. Mezzanine CDOs are worthless after a 1.2% decline in the value of subprime mortgages (5%*24%)! Suddenly those AAA CDO2 do not seem that safe anymore, especially so knowing that delinquency rates on subprime mortgages are way north of 1.2%. However, one needs to look at the entire chain of securitization to understand that. Most buyers of AAA CDO2 did not do that (they usually could not do that given the information available) and only looked at the high return of AAA CDO2 relative to AAA corporate bonds, together with the 40% buffer against loss provided by other CDO2.
There is a way to estimate what the leverage is in this type of transaction (see page 26 here). Financial institutions created many SPEs that bought from each other. Propublica has a very nice visual made with actual data.
Balance-sheet leverage, some data
The Financial Accounts of the United States provide simple measures of balance-sheet leverage that are easy to get for the private non-financial sector because actual balance sheets are provided. We are not so lucky for the financial sector for which data about total assets is not available. One can get an idea of the leverage by using the ratio (liabilities + equity)/equity, knowing that in theory the sum of liabilities and equity ought to be equal to total assets. In practice the sum of liabilities and equity is not very reliable and gives leverage levels that sometimes are much too high. Figure 2 only presents data that seems to kind of pass the smell test. Post 8 presents official leverage data in the banking sector.
Figures 7 and 8 give a broad idea of the relative leverage across sectors and of the trend in leverage. Clearly, the non-financial sector is less leveraged than the financial sector with households being the least leverage of all sectors. Overall, leverage in the non-financial sector has grown relatively smoothly until the Great Recession, especially so for households. Leverage in the financial sector is much more volatile.
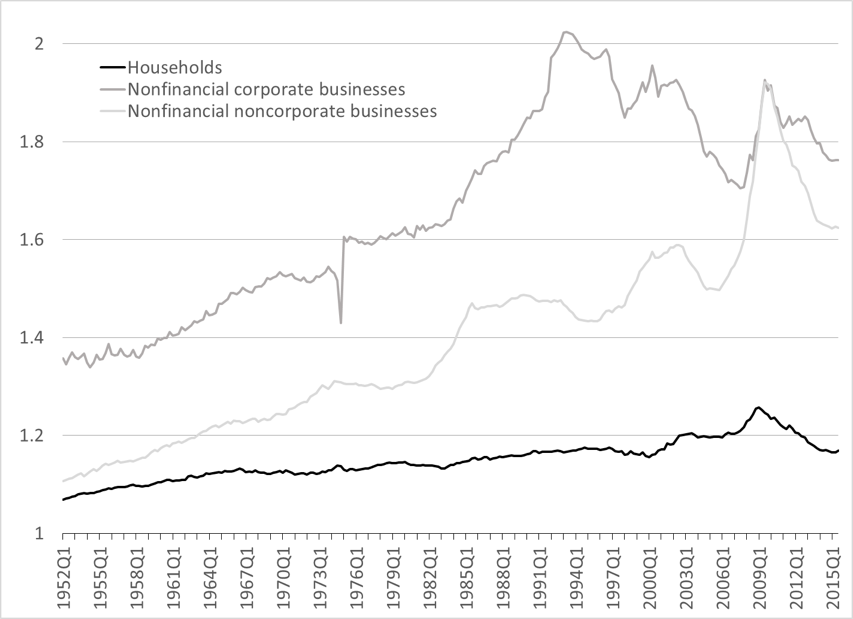
Figure 7. Leverage in the nonfinancial private sectors, assets/net worth
Source: Federal Reserve
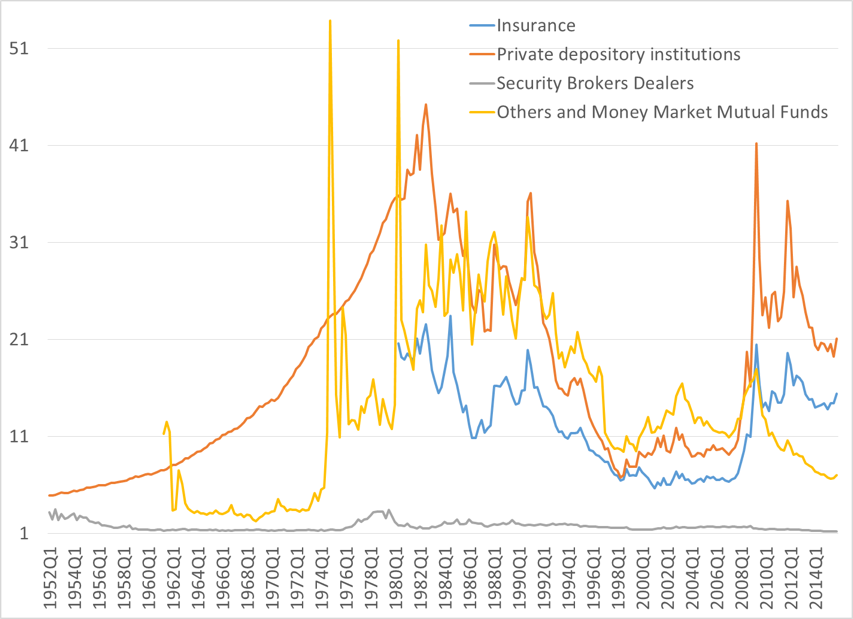
Figure 8. Leverage in the financial sector, (liabilities+equity)/equity
Source: Federal Reserve
The Financialization of the Economy
The financial industry is in the business of dealing with leverage. Its business is about incentivizing other to go into debt (that is what most of its assets are: claims on others) and the financial sector itself uses a lot of leverage to boost the profitability of its business. Banks grant credit, pension funds rely on financial claims to pay pensions, etc. For every creditor there is a corresponding debtor and so for every financial asset there is a corresponding financial liability: financialization also means debtization of the economy.
The financialization of the economy means that the financial sector has become much more important to the daily operations of the economic system. The private nonfinancial sectors have become more dependent on the smooth functioning of the financial sector in order to maintain the liquidity and solvency of their balance sheet, and to improve and maintain their economic welfare.
Households have become more reliant on financial assets to obtain an income (interest, dividends and capital gains) and have increased their use of debt to fund education, healthcare, housing, transportation, leisure, and, more broadly, to maintain and grow their standard of living.
Nonfinancial businesses also have recorded a very rapid increase in financial assets in their portfolio and a growing use of leverage. Some of them, like Ford or GE (until recently), have a financial branch that provides more cash and cash flow than their core nonfinancial activity (Figures 11, 12). The counterpart of these trends has been a growing share of outstanding financial assets held by private finance (Figure 9). From the late 1960s, the share of financial assets held directly by households dropped significantly from about 52 percent to 30 percent. Instead, a growing share of assets has been held by private financial institutions, which went from 25 percent in the late 1940s to 40 percent right before the crisis. The rest of the world recorded most of the rest of the gains from 2 percent to 10 percent of U.S. financial assets. The share of national income going to the financial industry has also grown quite significantly after WWII (Figure 10). A first wave occurred in the 1950s and a second one in the 1980s and 1990s. Today, about 18% of national income goes to the financial sector, something not seen since the 1920s.
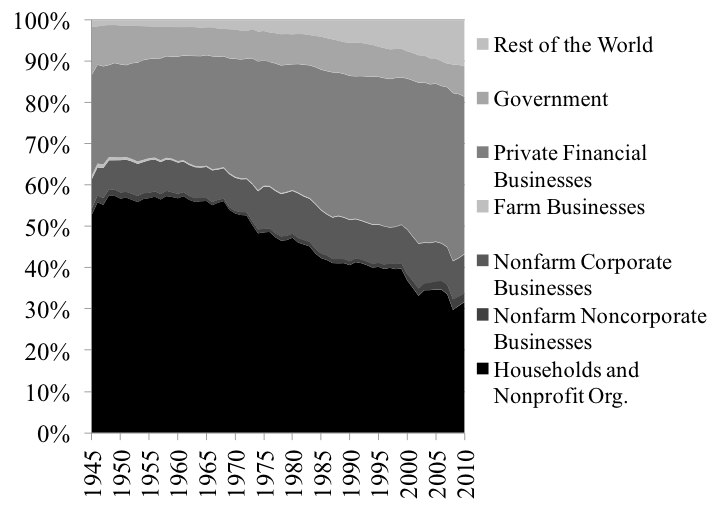
Figure 9. Distribution of U.S. Financial Assets among the Different Macroeconomic Sectors.
Source: Federal Reserve
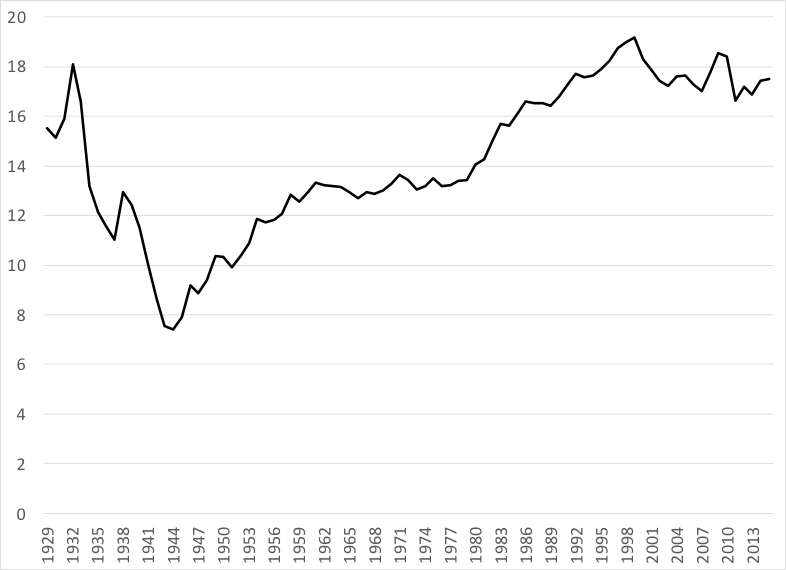
Figure 10. Proportion of National Income Earned by the Financial Sector.
Sources: BEA, Historical statistics of the United States

Figure 11. Percent of Cash Balance Coming from Financial Activities
Source: SEC (10K statements)
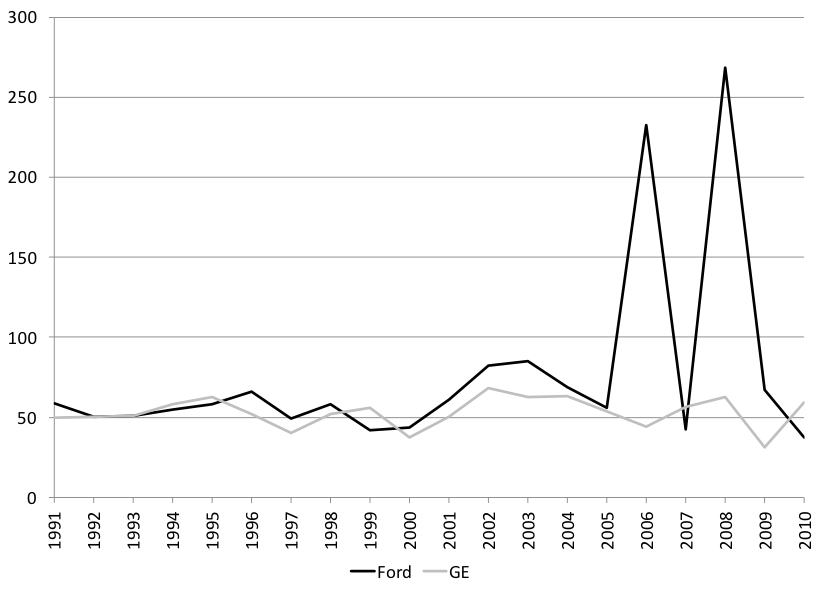
Figure 12. Percentage of net cash flow coming from financial activities.
Source: SEC (10k statements)
Done for today! Next post will start digging into the operations of commercial banks (it will be a long post…yes! this was a short post!).
[Revised 8/2/2016]


7 responses to “Money and Banking Part 7: Leverage”