Paul Krugman’s July 15th blog post diagramming financial balances makes some important steps in revealing the analytical power of the financial balance approach to macroeconomics – something once understood by J.M Keynes and early Keynesians like Nicholas Kaldor, Abba Lerner, and Joan Robinson, but long since lost in the headlong rush over the past three decades of mainstream macroeconomics to become a special branch of microeconomics, which itself appears to have become a special branch of applied calculus in some sort of rather twisted physics envy. I suspect reading Minsky has helped Paul immeasurably in seeing these relationships, and I would urge him and others to go find some of Wynne Godley’s contributions (many of which are available online at the Levy Economics Institute) to a stock/flow coherent macroeconomics, and it may all become that much clearer.
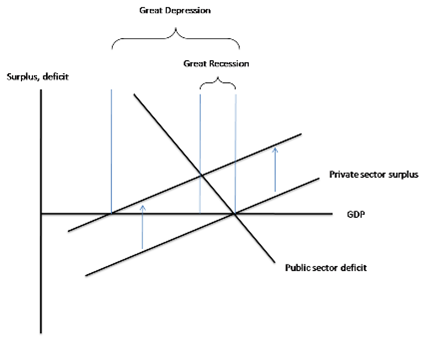
The diagram Paul presented at first (reproduced below) threw me for a loop, but I believe I now see what he was doing, as the labeling did not initially make it clear, and perhaps by walking through Paul’s diagram, others can avoid my initial confusion.

The upward sloping line should be labeled the private sector financial balance (PSFB), and the downward sloping line should be labeled the government financial balance (GFB). Only the part of the PSFB schedule above the horizontal axis is in surplus, if this horizontal GDP axis crosses the vertical sectoral financial balance axis at zero. Similarly, only that part of the GFB schedule above the horizontal axis is in deficit. I believe Paul has defined the vertical axis such that the range above zero represents a rising PSFB, and at the same time, a falling GFB of the same absolute amount, but of opposite sign. Then the area below zero is a falling PSFB and a rising GFB. Above zero represents a private sector financial surplus and a government deficit, while below zero represents a private sector deficit and a government surplus.
Confusing at first, but this follows because Paul has simplified the analysis to two sectors, and sectoral financial balances must balance ex post for any accounting period. The range above zero representing a private sector surplus must also represent a government deficit (GFB must be of equal magnitude but opposite sign to the PSFB). This would seem consistent with Paul’s GFB schedule falling below zero as GDP increases, since a falling fiscal deficit would eventually give way to an increasing fiscal surplus as income increases if automatic stabilizers work as we believe they do (see previous post here). Similarly, the rising PSFB schedule is consistent with traditional Keynesian stability conditions, with saving increasing faster in income than investment does, although we should all keep in mind, as Minsky emphasized, that explosive growth dynamics (Minsky’s upward instability) can arise in economic expansions characterized by euphoric asset pricing. Hence, the last two US business cycle expansions have been characterized by a falling PSFB (that is, deficit spending by the household and business sectors combined), not a PSFB rising as income rises, but that can be accommodated in less simplified versions of Krugman’s cross.
Another way to see why this interpretation of the diagram must be correct is that when the PSFB schedule shifts up and to the left, representing a higher desired net private saving at each level of income, the new point of intersection with the GFB schedule would, for example represent a new short run equilibrium point where say a $250b net private saving position is met by a $250b fiscal deficit. Again, sectoral financial balance must balance ex post (as explained in prevoius posts here and here). If one sector is running a net saving or surplus position, the other sector must be dissaving or deficit spending. That is the tyranny of double entry book keeping – not high Keynesian theory.
If I now have the orientation of the diagram straight in my head (and this is the only way I can see that it makes sense), those who believe in fiscal rectitude may wish to notice two aspects of the world we live in. If you view a balanced fiscal budget as the ultimate and over riding goal, you can get there one of two ways from Paul’s second PSFB schedule (the higher line we seem to have shifted to, as asset prices and profitability have collapsed over the past year, thereby forcing lower private investment and driving saving out of private income flows higher).
To arrive at a fiscal balance, you can shift the GFB schedule down and to the left by jamming tax rates higher and lowering the government spending propensities out of tax revenue income until the GFB schedule intersects the PSFB schedule at the point where the PSFB schedule crosses the horizontal axis at the zero financial balance mark. Notice the level of income the economy is then operating at, and all of you who pay dues to the Concord Coalition, please consider whether existing private debt loads could actually be serviced at that lower level, since most private debt contracts are fixed nominal payment commitments. Think post Lehman bankruptcy, on steroids, and you might get a taste of what you are praying for with perpetually balanced fiscal budgets.
The second way to get to a fiscal balance is to encourage the PSFB schedule to shift down and to the right until it intersects the GFB schedule at the point at which it crosses the horizontal axis. That means increasing incentives for the private sector to invest more money at each income level and save less money at each income level. Given the residential housing stock overhang, and the need for households to save out of income flows if they cannot rely on serial asset bubbles to deliver the appropriate nominal net worth at retirement, that means ways must be found to encourage US businesses to pursue a higher reinvestment rate in the US, rather than borrowing money to buy back shares to boost stock prices or reinvesting abroad. Not easy, but not impossible either. Notice also that the second form of adjustment leaves you at a higher equilibrium income level, and the existing private debt to GDP ratio will stabilize, since there will be no additions to the private debt stock, as net private deficit spending is zero at the new income flow level.
Of course, this should all eventually be recast in dynamic terms. For example, income won’t grow unless the GFB is continually shifting up and to the right, or the PSFB is continually shifting down and to the right (or some combination of the two). There is also no obvious endogenous mechanism shifting the PSFB toward a position of full employment income over time, given the position of the GFB. Of course, in theory, policy could be geared such that given reasonable estimates of the likely position of the PSFB schedule, the GFB schedule could be shifted out (or less likely, in) to achieve the level of income associated with full employment. Alternatively, fiscal policy could be structured so the GFB schedule could be perfectly vertical at the full employment level of income, which in many ways is what an employer of last resort (ELR) driven fiscal policy attempts to do.
Finally, for those insistent that public and private debt to income ratios must be held fixed from here to eternity for whatever reason, then starting from Paul’s initial equilibrium, income growth could only be accomplished if the PSFB schedule could be encouraged to shift outward, and the GFB could be shifted in concert such that either the realized financial balances of both sectors were kept at zero, or there was some cycling between the two, such that periods of private sector financial deficits were followed by periods of government sector deficits of similar magnitude and duration.
The trade balance must also be brought back into the story, as a trade surplus is the only way both the GFB and the PSFB can maintain a net saving position at the same time (assuming for whatever reason that was a worthy goal), but at least it is a promising start at representing how sectoral financial balances are related, and it reveals many of the misconceptions that unnecessarily cloud the debate.
If the Krugman Cross does nothing more than provide a stepping stone away from the dead end trap of the Hicks/Harrod/Meade IS/LM diagram, then this is a useful initial contribution. Caught under the spell of IS/LM conventions, Paul and other New Keynesians have spilled far too much ink trying to devise ways of instituting negative real interest rates to get the economies out of a balance sheet driven recession. With policy rates near zero, this analysis has devolved into arguments about how best to increase inflation expectations or actual inflation in order to achieve a sufficiently negative real interest rate. From a practical point of view, the last thing households facing heavy debt servicing loads with falling wage and salary incomes need are rising consumer prices that drain their already reduced discretionary income. Households need higher money incomes, not higher consumer prices, expected or actual, to exit their current difficulties. Real interest rates are diversion from the real problem at hand in a balance sheet recession, which is how to get the economy to a point where money income levels can service most private debts. Krugman’s Cross makes it obvious – shift the GFB schedule in response to shifts in the PSFB schedule.
As always, we must be careful about sliding between the usual ex ante/ex post distinctions, as the income multiplier lies masked behind these interactions, as does the reconciliation of new liability issuance with portfolio preferences, among other balance sheet and asset price considerations that must be brought into play for a coherent stock/flow macroeconomics, of which Hick’s IS/LM approach was a pale shadow that concealed more than it revealed.
For example, the private sector may plan to net save more at any given expected income or GDP level, but unless some other sector net saves less or deficits spends more, private incomes will adjust downward, and the desired private net saving will be thwarted, paradox of thrift style. If Paul recalls his reading of Keynes’ General Theory (and he is to be applauded for being one of the few New Keynesians to actually read Keynes in the original), this is one of the reasons Keynes argues incomes adjust to close gaps between intended investment and planned saving. Interest rates do not equilibrate investment and saving – incomes do, in Keynes’ General Theory. Paul has taken a very large step in this direction with his financial balance diagram, which hopefully he will find more powerful than his IS/LM analytics which he employed in the case of the Japanese balance sheet recession.
Specifically, Paul refers to the need for net private saving being “absorbed” by the public deficit spending. That assumes the net private saving can exist without some other sector deficit spending at the same time, which is impossible. William Vickrey and James Tobin used to make a similar slip, with Vickrey arguing the private saving had to be recycled by public deficit spending (see Vickrey’s otherwise useful piece on 15 fundamental fallacies, linked at CFEPS here.
In Paul’s 2 sector model, unless the public sector spends more money than it takes in as tax receipts, the private sector cannot earn more money than it spends, no matter what its plans or intentions or ex ante designs. Net private saving is created, allowed, or constrained by the size of the public deficit. Net private saving cannot exist as anything more than a hope and a prayer unless some other sector is willing and able to deficit spend. Ex post, in a 2 sector model, as a matter of basic accounting, the net saving of one sector must be equal to the net deficit spending of the other. That is the short run accounting “equilibrium” or reality.
Moving beyond a simple 2 sector model to the world we actually inhabit, it is really as simple as this. The US household sector cannot net save in nominal terms (spend less money than it earns) unless some other sector (or combination of sectors) is willing and able to spend more money than it earns.
It can be the government, the business, or the foreign sector or some mix of the three that net deficit spends – take your choice. But keep in mind, of the three, a government with a sovereign currency (not convertible into fixed quantities of a commodity or another currency on demand) and no debt denominated in foreign currencies is the only one of those three that cannot go bankrupt and cannot default on its debt while continuously deficit spending – unless it chooses to default for some odd political reason.
The sooner we face this fundamental reality of contemporary monetary and economic arrangements, the better. It does not require swearing allegiance to high Keynesian theory – it is simply an accounting reality. Reject it, and you will also have to throw at least seven centuries of double entry book keeping out the window as well.
Since the US economy does appear to have entered a debt deflation spiral for the first time in a lifetime, and it does appears that the spiral has been contained for the moment by a reduction in the trade deficit and a surge in the fiscal deficit, it might be a good time for economists, investors, policy makers, and the general public to once and for all find some clarity on these questions regarding financial balances and the economy. Perhaps Paul’s simple back of the napkin diagram of financial balances takes us one step in that direction.


Pingback: Krugman’s New Cross Confirms It: Job Guarantee Policies Are Needed as Macroeconomic Stabilizers | | New Economic PerspectivesNew Economic Perspectives
Pingback: MMT, The Euro and The Greatest Prediction of the Last 20 Years | | New Economic PerspectivesNew Economic Perspectives