
Regulated Portfolio Management Companies: Mutual Funds and Others
Portfolio management companies provide a wide variety of placement opportunities to economic units with spare funds who do not want to, or cannot, directly buy securities or other assets. There are three broad types of portfolio management companies: mutual funds, closed-end funds, and unit investment trusts (UITs). One of the main differences between them is the characteristics of the shares they issue in terms of marketability and redeemability. Mutual fund shares are nonmarketable and redeemable on demand, closed-end fund shares are marketable and irredeemable, and UIT shares are marketable and redeemable on demand. Closed-end funds and UITs do not continuously offer their shares for sale. Rather, they sell a fixed number of shares in an initial public offering, after which the shares typically trade on a secondary market such as the New York Stock Exchange or through the sponsor (for UIT). The price of closed-end funds is determined by the market and may differ greatly from the net asset value per share (see below). Another main different is the type of asset they are allowed to acquire, with closed-end funds allowed to buy more illiquid assets than mutual funds.
Within each of these three broad categories, there is a wide variety of funds in terms of the assets they purchase, the placement strategies, and the means of issuance and redemption of shares (cash redemption or security redemption). This wide variety of funds accommodates the financial preferences of most shareholders. For example, some like risks and others do not; some like stocks others prefer bonds; some want stable fund share prices others want to be able to make capital gains (while risking to make a loss). They also have different level of minimum financial contribution to cater to different wealth groups. The following focuses on mutual funds, which are the most common type of portfolio management companies.
Mutual funds became popular in the U.S. in the 1920s, but have existed since the 19th century. They issues shares to whomever wants to join, and use the proceeds to buy earning assets for the benefits of the members. As shown in Post 18, 80 percent of mutual funds shares are held directly or indirectly (via pension funds) by households. Mutual funds are open-end companies, that is, the outstanding number of shares is allowed to change on a daily basis. The shares of mutual funds are not tradable and are redeemable on demand, which is quite different from corporate shares that are tradable and irredeemable. Economic units who want to place some funds in a mutual fund must purchase shares from the mutual fund itself, not from other bearers. When economic units wish to retrieve their funds, they can redeem them—that is, sale them back to the mutual fund—for a fee.
The price that an economic unit pays for mutual fund shares is approximately the net asset value (NAV) per share. The NAV is the net worth of the funds (assets net of liabilities). For example, if a mutual fund has $100 of assets and $10 of liabilities, NAV is $90. The NAV is calculated on a daily basis by recording how the value of assets and liabilities at the end of each day. The price at which a share can be bought and redeemed is the NAV per share, and this price varies on a daily basis because of daily changes in the NAV and in the outstanding number of shares. So, if the NAV is $90 and there are 100 shares outstanding, the price of a mutual fund share is 90 cents that day.
In the mid-1970, money market mutual funds (MMMFs) emerged to bypass regulation Q. They purchase mostly short-term, safe securities. MMMFs try to keep their NAV per share stable at $1 and the dividend paid on MMMF shares closely follows short-term interest rates. Given these financial characteristics and the fact that MMMF share are redeemable on demand, financial market participants consider MMMF shares to be close substitutes to savings accounts offered by private depository institutions.
Most assets of mutual funds are composed of corporate shares except for the decade 1985-1995 during which Treasuries, agency securities, and municipals grew to represent 40 percent of the financial assets of mutual funds. Today, these types of securities only represent 15 percent of the $12.6 trillion of financial assets held by mutual funds, while corporate shares represent 65 percent of the financial assets. As the stock market plunged during the Great Recession, mutual funds recorded a $3-trillion decline in the value of their assets, but they recovered their losses quickly as the stock market boomed again (Figure 19.15). Their liabilities is composed mostly of their shares, but also of individual retirement accounts (IRAs) that have grown to represent 20 percent of liabilities (Figure 19.16).
The assets of MMMFs are composed mostly of safe to safer assets that are of short-to-medium term maturity, such as commercial papers, T-bills, agency securities, Treasuries, time and savings accounts, and repurchase agreements (Figure 19.17). Prior to the crisis, MMMFs bought a lot of asset-backed commercial papers because they looked safe but, as explained in the post on securitization, were not so. During the crisis, some MMMFs recorded large losses on asset-backed commercial papers and the value of their assets fell by $1 trillion to $2.8 trillion. This led the NAV per share to fall below $1 for some MMMFs; customers could not recover 100 percent of the principal they put in the fund, in the same way one could not recover 100 percent of the funds in a savings account. As the NAV per shares fell below $1, a run on MMMFs began—many customers tried to recover their funds by redeeming their MMMFs shares at the same time, forcing MMMFs to sale assets quickly—that compounded the decline in the value of MMMF shares, and the Federal Reserve intervened to help contain the run.
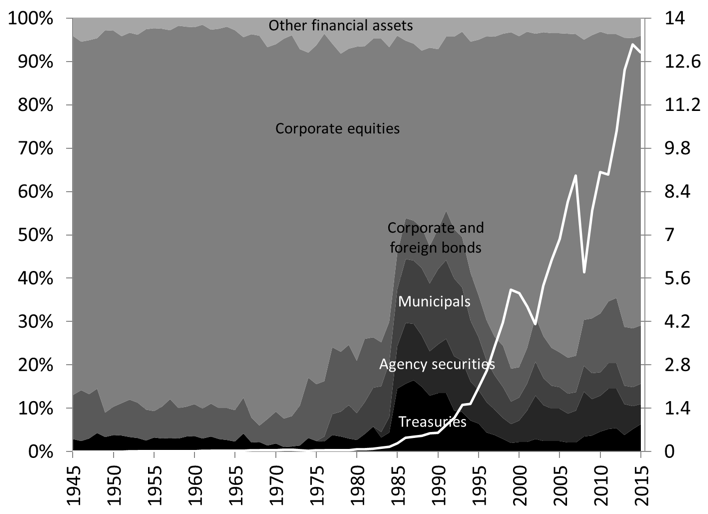
Figure 19.15. Structure (percent) and level (trillions of dollars) of the assets of mutual funds
Source: Board of Governors of the Federal Reserve System (Series Z.1, L.122)
Note: No information is shown about currency and checkable deposits because the Financial Accounts assumes all monetary instruments received is immediately put to work. How the funds are used (that is which financial assets goes if more funds are received) is based on econometric analysis or discretionary decisions of Federal Reserve analysts.
Note: “Other financial assets” includes commercial papers, syndicated loans to nonfinancial businesses and security repurchase agreements
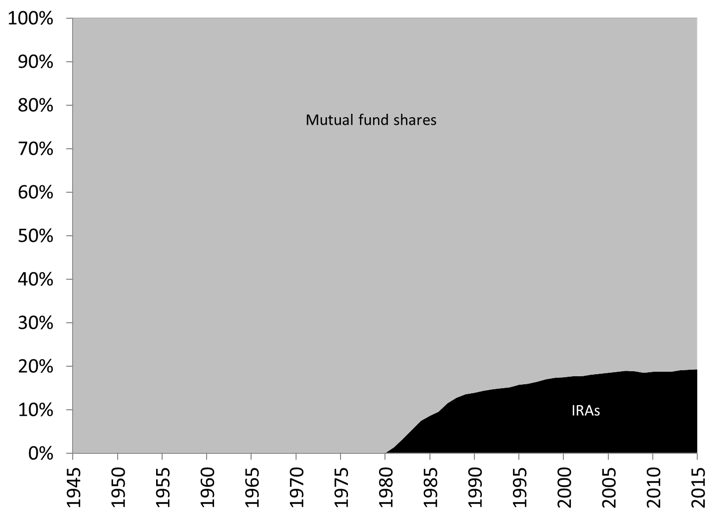
Figure 19.16. Structure of liabilities of mutual funds
Source: Board of Governors of the Federal Reserve System (Series Z.1, L.122 and L.227)
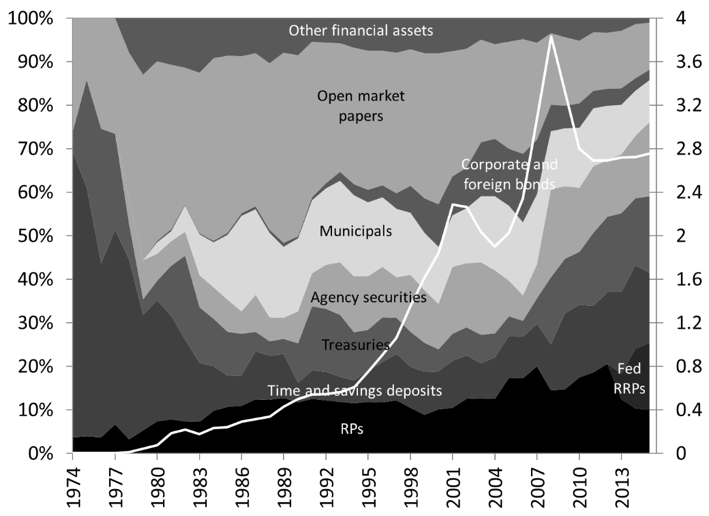
Figure 19.17. Structure (percent) and outstanding dollar amount (trillions of dollars) of the assets of money market mutual funds
Source: Board of Governors of the Federal Reserve System (Series Z.1, L.121 and L.227)
Note: “Other financial assets” includes checkable deposits, private foreign deposits, among others.

Figure 19.18. Structure of liabilities of money market mutual funds
Source: Board of Governors of the Federal Reserve System (Series Z.1, L.121 and L.227)
Lightly Regulated Portfolio Management Companies: Hedge Funds
Hedge funds emerged in the 1950s. Like mutual funds, hedge funds pool funds to buy return-earning assets but, unlike mutual funds, they frequently use riskier balance-sheet strategies, such as leverage (see Post 7) and short selling, to achieve the rate of return they promise to their clients. Hedge funds are also more lightly regulated and may not have to file full financial statements with regulatory agencies, although the 2010 Dodd-Frank Act increased the regulatory filing requirement. Finally, they cater to wealthy individuals.
Some hedge funds try to make a profit under whatever market conditions by implementing “market neutral strategies.” This means that they speculate on the price direction of two assets by taking an opposite position in each asset. For example, assume that the stocks of companies X and Y are worth respectively $100 and $90. Hedge fund Alpha expects that the price of both stocks to be $95 in one week (Figure 19.19).

Figure 19.19. Expectations of hedge fund Alpha about the price direction of two stocks
The hedge funds does two things to profit from this expectation:
- Take a short position in X shares: Borrow X stocks from a broker for a week and sell them immediately at current market price ($100), and buy them back at $95 next week to repay the broker. A capital gain of $5 per share is expected.
- Take a long position in Y shares: Buy Y stocks today for $90 and sell them in Week 2 at $95: Expected capital gain of $5 per share.
This placement strategy allows Alpha to “hedge” its portfolio position because it can avoid losses, to a certain extent, if its expectations turn out to be incorrect. For example, assume that both stock prices decreases by $10, in that case, the funds loses $10 on its long positions in share Y but gains $10 on its short positions in share X (Figure 19.20). Of course, if X stock go up or go down by less than Y shares, then Alpha will record a loss.

Figure 19.20. Actual price direction of two stocks
Short positions are inherently more risky than long positions because the price of financial assets cannot be negative so potential gains are limited by how much price can fall ($100 for stock X) while potential losses are unlimited (the price of stock X can to up to infinity).
Real Estate Investment Trusts
They were created in the 1960s to provide opportunities to take a position in real estate. They hold about $500 billion in assets tied to the real estate in the form of actual real estate properties or financial instruments linked to real estate (mortgages, agency securities, mortgage-backed securities) (Figure 19.21). REITs also issue mortgages that, together with bonds, usually represent over half of the liabilities they issue. Their short-term debts are in the form of reserve repurchase agreements and advances from private depository institutions (Figure 19.22).
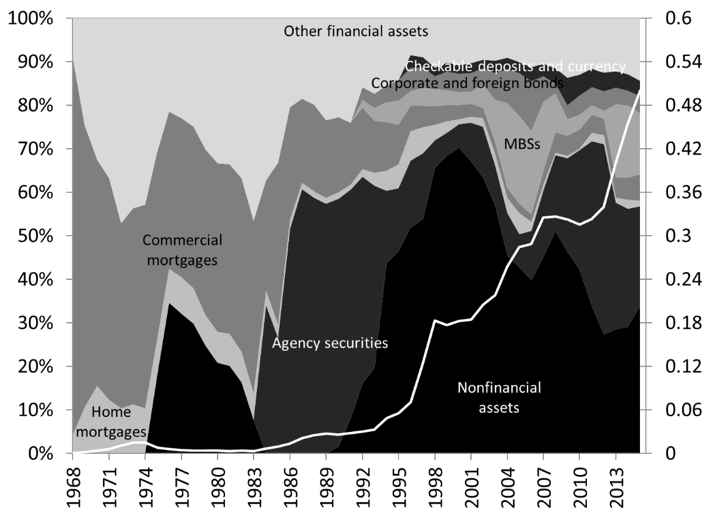
Figure 19.21. Structure (percent) and level (trillions of dollars) of real estate investment trust
Source: Board of Governors of Federal Reserve System (Series Z.1, L.129)
Note: Nonfinancial assets have a negative value from 1968 to 1974 and from 1984 to 1989. This is due to statistical discrepancies and errors because their value is measured indirectly as the difference between liabilities and financial assets. The value is set at zero for those years.
Note: “Other financial assets” includes multifamily mortgages and other financial assets.
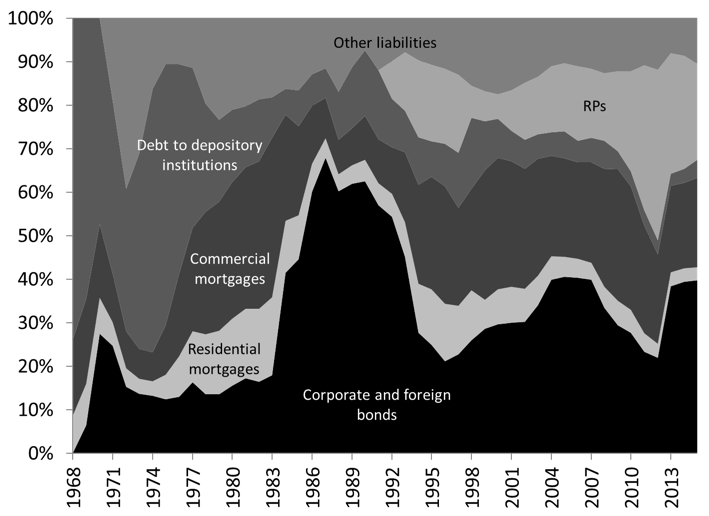
Figure 19.22. Structure of liabilities of real estate investment trust
Source: Board of Governors of Federal Reserve System (Series Z.1, L.129)
Note: “Other liabilities” include advances by the Federal Home Loan Banks, commercial papers, among others.
Financial Market Companies
Market-Services Companies
Securities do not trade themselves; there needs to be a platform that is reliable and standardized so trading can be done smoothly and at low cost. Some businesses specialize is setting up such a platform. A market platform sets up trading rules, quotation methods, methods of buying and buying securities, and provides smooth means to transfer of securities among parties. It also provides other market services such as extensive market data and trading services.
The most well-known market platforms are the New York Stock Exchange (NYSE) and the NASDAQ. NASDAQ used to be the acronym of “National Association of Securities Dealers Automated Quotations” until the company became independent from the National Association of Securities Dealers in 2006. Created in 1971, NASDAQ was the first market platform to provide automated trading of securities and competitors followed.
Market platforms used to be a noisy place in which many individuals were on the phone taking sell/buy orders from clients and were “talking” (more yelling) to each other to match orders. The place was actually so noisy that individuals working on the floor of the market had to develop some hand signals to be able to carry their trading operations. Today, most market platforms are very quiet places except for a few markets that have not been automated. The NASDAQ is fully automated and its physical place is a room with a giant digital screen on Time Square.
Once a platform has been set up, some businesses specialize in provide specific market services; issuing securities, ensuring the continuous quotation of securities, redeeming securities, trading securities, among others.
Investment Banks
Investment banks complement commercial banks by focusing on the needs of medium to large businesses, governments and other economic units with large needs for funds (think at least tens of millions of dollars). When a client X needs a large sum of funds to build an expensive illiquid long-term project with an uncertain profitability—railroad, industrial plant, nuclear plant, Channel tunnel between the UK and France—a commercial bank is not willing to take X’s financial instrument. Indeed, it would be a very large single financial asset on the bank’s balance sheet that would greatly negatively impact its net worth in case of problem (see Post 9). A bank would is even more so reluctant that complex industrial projects usually run into delays, record significantly larger expenses than budgeted, and take decades to break even.
One solution is to share that risk through syndicated credit in which several commercial banks and other financial institutions join to meet the financial needs of the client. However, even in that case, banks usually do not want to keep all their share of financial instruments of X on their balance sheet and gauge the ability to sell some of them before agreeing to provide credit to client X. Figure 19.23 shows that syndicated credit to nonfinancial businesses boomed in 2004 to reach $550 billion. Major bearers are special purpose entities (“issuers of ABSs”), mutual funds, security brokers and dealers, life insurance companies, and funding corporations.
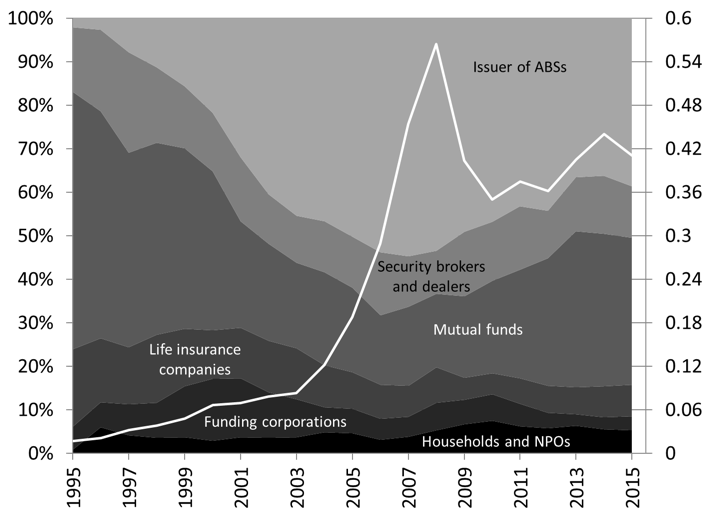
Figure 19.23. Syndicated credit to nonfinancial businesses
Source: Board of Governors of Federal Reserve System (Series Z.1, part of L.216)
While syndicated credit has become more popular, its outstanding volume is still small, especially compared to alternative wholesale funding methods. Indeed, beyond syndicated credit, another solution to spread the risk is to issue many marketable financial instruments. Say client X needs $100,000,000, one way to obtain that sum is to issue 100,000 bonds with a face value of $1,000. Each bearer takes on its balance some credit risk for up to the dollar amount of bonds each bought, which is much more limited than if a commercial bank had to bear a single non-marketable financial instrument worth $100,000,000. In addition, bonds can be traded—at least this is the hope—so if some of the initial bearers no longer want hold the bonds, they can sell them to willing buyers.
While they may issue securities on their own, economic units who seek funds by issuing marketable financial instruments may ask for the help of an investment bank in order to maximize the dollar amount raised by the offering. Investment banks assist issuers of securities by determining which type of securities will be the cheapest to issue, evaluating the creditworthiness of the issuer, and providing economic and financial research to financial market participants. Investment banks design, market and underwrite securities in the primary market:
- “Design” means to:
- Determine which type and what quantity of securities should be issued in order to raise as much funds as possible at the lowest cost: if stock markets are booming then issuing shares is a better option, whereas issuing bonds is best if interest rates are low and profit expectations of the issuer are high.
- Help meet filing requirement with the Securities and Exchange Commission
- Help get a rating from credit rating agencies by making sure that the issuer complies with all the necessary requirements.
- “Market” means to determine the expected sale price of securities and to sell them:
- Initial public offering (IPO): For shares, investment banks must figure out what is the fair price for the shares of a company that enters the stock market for the first time. For bond, pricing is easier and based on the price of bonds of comparable risk and term to maturity.
- Seasoned offering: Pricing is based on current existing securities but the investment bank must figure out how the new issue will affect the price of existing securities.
- “Underwrite:” Investment banks usually take some responsibility for the price at which they expect the securities will sell, that is, they sign a contract with the issuer that guarantees that the issuer will be able to raise a certain dollar amount of funds. If the securities sell above the contracted price, the investment bank makes a capital gain. If the securities sell below, the investment bank may stop selling securities for a while and hold the securities on their balance sheet.
Brokerage Firms: Security Brokers and Dealers and Security Brokers
Brokerage firms provide two types of market services:
- Brokering: To buy and sell securities for clients for a fee. The rise of automated trading and online brokerage accounts has significantly reduce the fees that brokers can charge.
- Dealing: To buy and sell securities for one’s own account. Dealers usually play an important role of market makers to promote market liquidity. They have specialists on the floor of the platform who act as buffer between the demand and supply of securities. If there is a surplus, specialists buy for their own account some securities to close the surplus; if there is a shortage, specialists sale securities they own to close the shortage. With the emergence of automated trading, the need for specialists has diminished considerably. Some dealers may choose to become primary dealers, which entail them to have a direct working relationship with the Federal Reserve to help implement monetary policy (Post 4) and fiscal policy (Post 6).
The balance sheet of security brokers and dealers reflects the fact that they deal in securities (Figure 19.24). Margin credit, that is advance provided to clients to buy securities on credit, use to represent up to 60 percent of their assets. From the 1970s, security repurchase agreements (RPs) have substituted margin credit as their main assets. Clients seeking funds sell securities to brokers and dealers, and promise to buy them back later at a price that will provide an income to security brokers and dealers. This is a form of secured credit. Post 4 explains how security repurchase agreement are used to implement monetary policy. The value of the assets held by security brokers and dealers peaked in 2008 at $4.6 trillion and has been falling since to reach $3 trillion in 2015. Since the late 1980s, a great proportion of the business operation of dealers and brokers has been to lend the securities they own. Claims on borrowers of securities have represented at least 20 percent of their balance sheet.
The structure of liabilities reflects the shift in assets (Figure 19.25). Security brokers and dealers used to be indebted to private depository institutions that provided the funds to clients requiring margin credit. Brokers and dealers would make a profit on the interest rate differential between the interest rate charged on margin credit and the interest rate charged on the credit that broker and dealers obtained from depository institutions. Since the 1970s, repurchase agreements, in the form of reverse repurchase agreements, have become the main liability of security brokers and dealers. They obtain funds by selling securities and by promising to buy them back later at a price that rewards the seller.
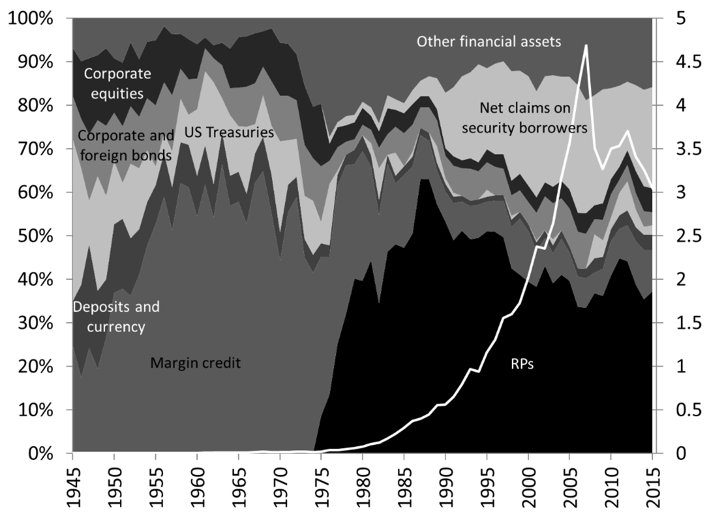
Figure 19.24 Structure (percent) and level (trillions of dollars) of the assets of security brokers and dealers
Source: Board of Governors of the Federal Reserve System (Series Z.1, L.130)
Note: At times, the outstanding value of US Treasuries is negative, reflecting the fact that security dealers had an overdraft on their Treasuries account at the Fed; they were borrowers of Treasuries.
Note: “Other financial assets” includes commercial papers, agency securities, municipals, syndicated advances to nonfinancial business, among others.
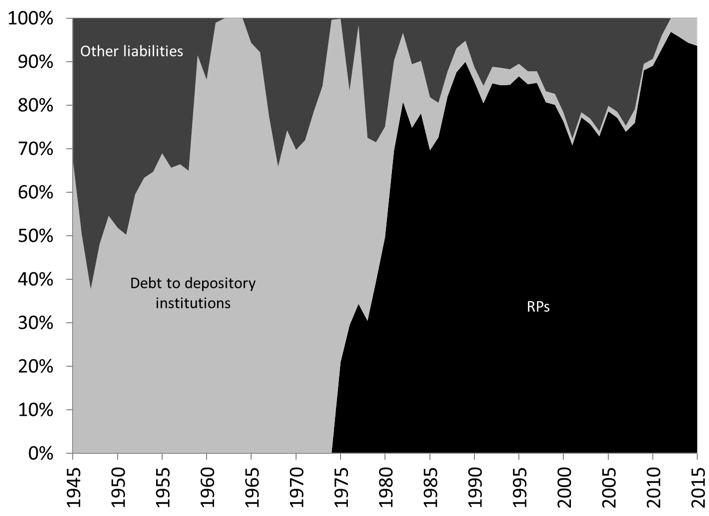
Figure 19.25 Structure of liabilities and equity of security brokers and dealers
Source: Board of Governors of the Federal Reserve System (Series Z.1, L.130)
Note: “Other liabilities” includes corporate shares, corporate and foreign bonds, various advances, trade payable, taxes payable, among others.
Securitization Vehicles: Special Purpose Entities
Securitization is discussed in a following post but the following Figures together with the ones presented in this post and in Post 18, should convince the readers that companies involved in securitization have become major participants in the financial sector. Figure 19.26 and 19.27 show the financial assets held by issuers of asset-backed securities and issuers of mortgage-backed securities backed by federal agencies and GSEs. Together, they held up to $8.5 trillion of financial instruments of all sorts in 2008, after which the outstanding value of their financial assets felt to reach $3 trillion, a big part of which is due to the sale of $3-trillion worth of mortgages to government-sponsored enterprises. Since early 2000s, mortgages have replaced consumer credit and agency securities are the main assets of issuers of asset-backed securities.
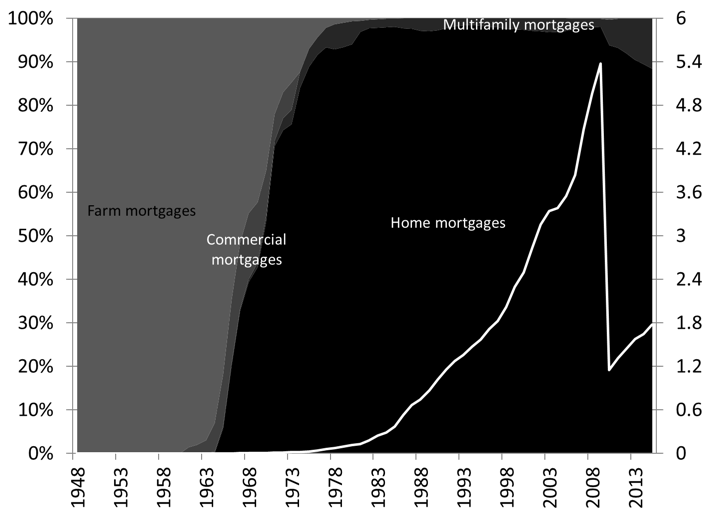
Figure 19.26. Structure (percent) and level (trillions of dollars) of the assets of mortgage pools backed by federal agencies and government-sponsored enterprises
Source: Board of Governors of the Federal Reserve System (Series Z.1, L.126)
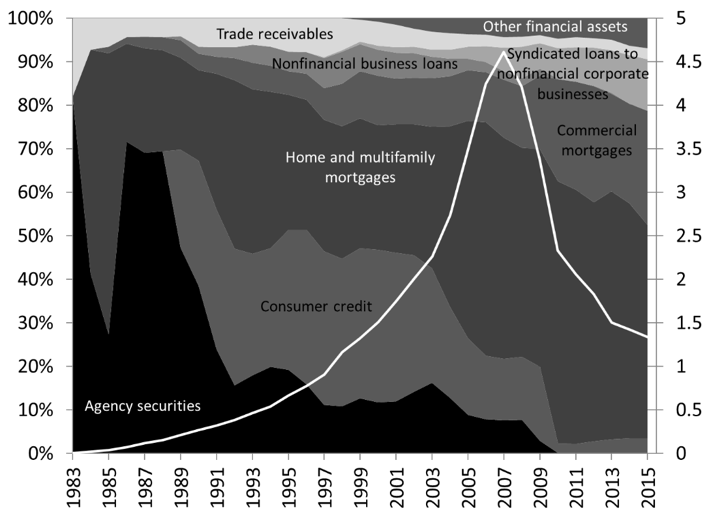
Figure 19.27. Structure (percent) and level (trillions of dollars) of the issuers of asset-backed securities.
Source: Board of Governors of the Federal Reserve System (Series Z.1, L.127)
Note: “Other financial assets” include funding agreement backing the ABS issuers and Treasuries.
Government and Government-Related Financial Agencies
Government and government-related financial agencies include some federal budget agencies and some for-profit companies chartered by the U.S. Congress. Their goal is to promote, through financial means, specific economic activities that are deemed socially beneficial but that are underserved by the traditional private financial sector because of their riskiness or low profitability.
Government-Sponsored Enterprises
Government-sponsored enterprises (GSEs) are private for-profit companies created by US Congress. They help to promote specific economic activities by buying and/or insuring illiquid and risky financial instruments that financial companies have on their balance sheet. By doing so they remove the credit risk—and liquidity risk if they buy the financial instrument—from the balance sheet of the seller. This encourages private financial companies to provide credit at more affordable terms (lower interest rate, longer term to maturity) to specific economic units. Put differently, the point of GSEs is to intervene in the financial sector to reduce the volatility, and to bring down the level, of interest rates on specific financial instruments, and to raise the volume of issuance of such financial instruments. GSEs do so because these financial instruments are issued to perform economic activities that U.S. Congress deems socially beneficial.
A point of entry in the world of GSEs are the Financial Accounts (Figures 19.28 and 19.29). From 1945 until the mid-1980s, advances from the Farm Credit System and the Federal Home Loan Bank System, Farm mortgages (that is mortgages backed by a farm excluding the farm dwelling), and home mortgages represented about 80 percent of the assets of GSEs. After the mid-1980s, the promotion of farming shrunk considerably in relative terms, with farm mortgages and Farm Credit System advances representing about 5 percent of the financial assets of GSEs in 2015. Agency securities, federal funds sold and corporate bonds gained in importance. The financial crisis led to an enormous increase in the balance sheet of GSEs because Fannie Mae and Freddie Mac purchased over $3 trillion of mortgage-backed securities from the special purpose entities (“mortgage pools”) they back. MBSs from these pools now represent 60 percent of the assets of GSEs. Most of the liabilities of GSEs consist of securities and securitized securities and the purchase of $3 trillion of MBSs by Fannie Mae and Freddie Mac was done by issuing bonds backed by them. The following sections provide a more detailed presentation of some GSEs.
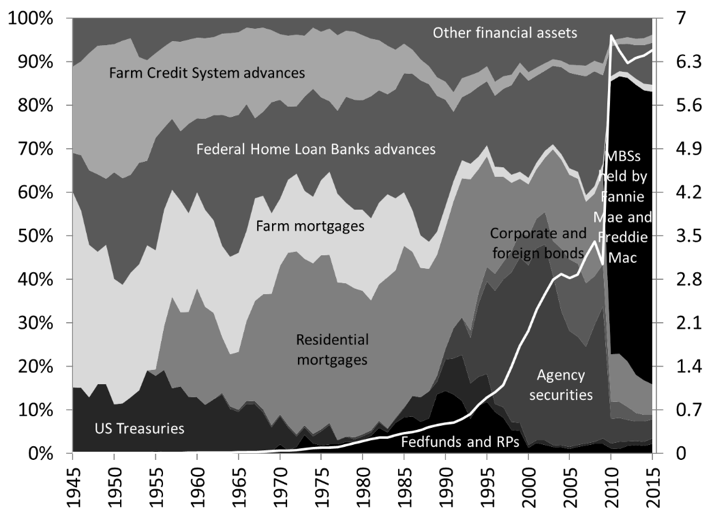
Figure 19.28. Structure (percent) and level (trillions of dollars) of the financial assets of government-sponsored enterprises.
Source: Board of Governors of the Federal Reserve System (Series Z.1, L.125)
Note: The GSE sector includes the following enterprises: Federal Home Loan Banks, Fannie Mae, Freddie Mac, Farmer Mac, Farm Credit System, the Financing Corporation, and the Resolution Funding Corporation and the Student Loan Marketing Association (Sallie Mae) until 2004:Q4. Mortgage pools backed by GSEs are not included.
Note: Others financial assets include Sallie Mae financial assets, commercial papers, checking, savings and time accounts, currency, among others.
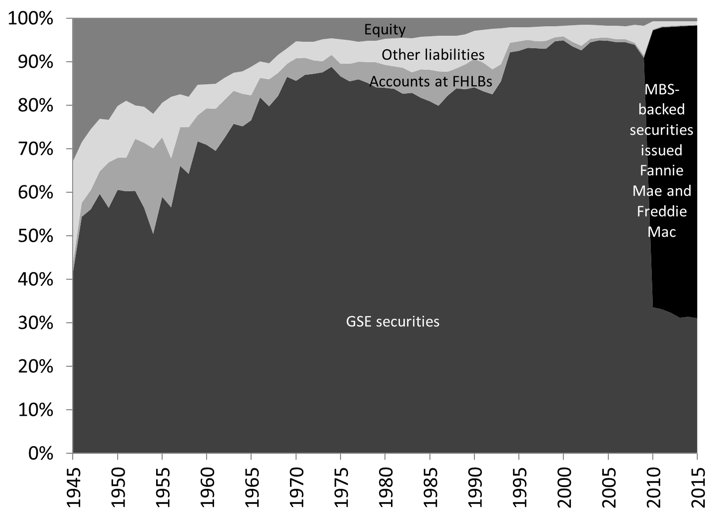
Figure 19.29. Structure of liabilities and equity of government-sponsored enterprises
Source: Board of Governors of the Federal Reserve System (Series Z.1, L.125)
Note: “Other liabilities” include federal funds purchased and reverse repurchase agreements, loans of U.S. government to Sallie Mae, among others.
The Farm Credit System
The Federal Loan Act of July 1916 created the first government-sponsored enterprise; the Farm Credit System (FCS). Its organization is based on the template provided by the Federal Reserve System created in December 1913. The goal of the FCS is to help the agricultural sector and rural communities by providing a stable and affordable source of funds to Agricultural Credit Associations (ACAs) and agricultural cooperatives that compete with private banks.
ACAs provide credit and leases services to rural providers of critical infrastructure (communication services, power supply, water supply, among others), rural households seeking to become homeowners, and farmers, ranchers, and other agribusinesses (to stock seeds, to buy capital equipment, to build barns, among others). Contrary to traditional banks, an ACA does not issue bank accounts to their clients; it merely accepts their financial instrument and makes payment on their behalf by using the payment system of private banks. For example, if farmer F1 is granted a credit of $100 to buy a $100 tractor, the following happens:

The ACA makes the payment to the tractor company on behalf of farmer F1, and F1 will repay the ACA bit by bit by servicing its financial instrument.
Each ACA is part of a district. The System is composed of four districts, each overseen by a Farm Credit System Bank that is owned by the ACAs (Figure 19.30). There are four Farm Credit System Banks (FCS Banks); three Farm Credit Banks (FCBs) and one Agricultural Credit Bank (ACB). The FCS Banks issues Farm Credit System debt securities (FCS securities) via a funding corporation (the Federal Farm Credit Banks Funding Corporation) that acts as fiscal agent for the four banks. The funding corporation determines the amount and terms of FCS securities, issues them and handles their servicing. The term to maturity of FCS securities varies from overnight to 30 years. The funds obtained from the issuance of securities are lent to ACAs and cooperatives who then lend to rural communities. Beyond obtaining funds from the issuance of FCS securities, ACAs also borrow funds from, and lend funds to, each other.
The Farm Credit System Insurance Corporation—established in 1987 when farmers were defaulting en masse—ensures the timely servicing of FCS securities. It is an insurance plan in which each ACA pays a premium and gets help in case of difficulty. The overall system is overseen by the Farm Credit Administration (Figure 19.31).
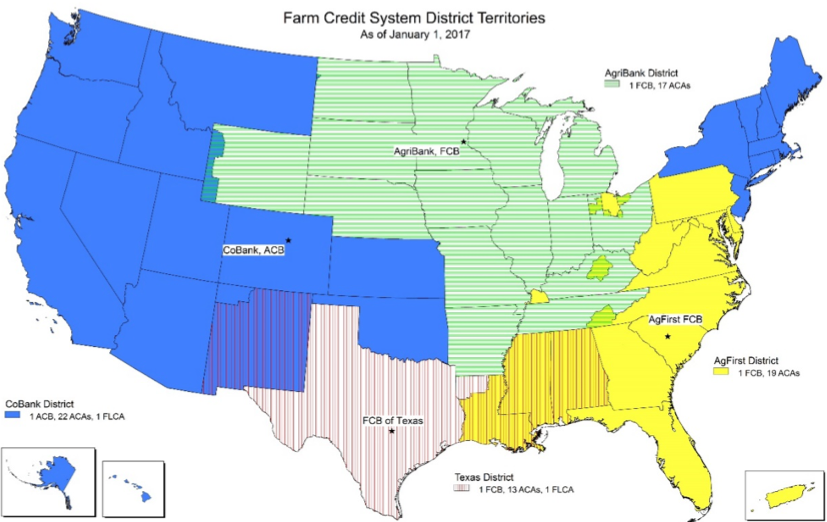
Figure 19.30. Districts of the Farm Credit System
Source: Farm Credit Administration
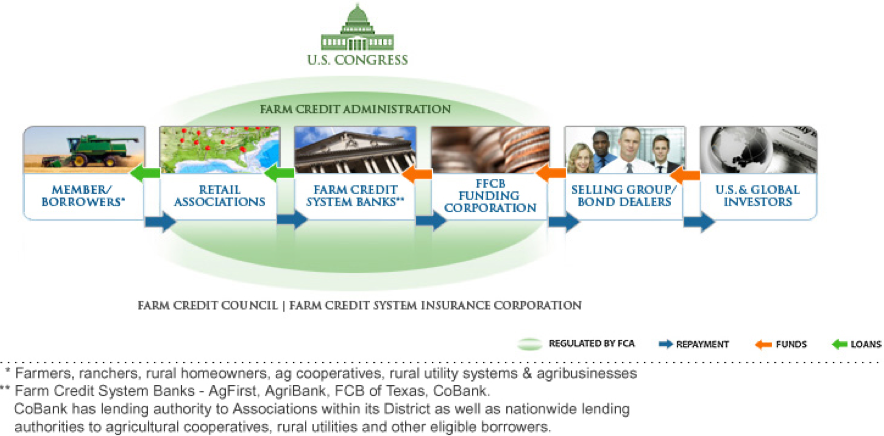
Figure 19.31. The institutional components of the Farm Credit System
Source: Federal Farm Credit Banks Funding Corporation
Table 19.1 shows the unconsolidated balance sheet of the four FCS Banks. Their main assets are securities (mostly Treasuries, federally-backed debts and GSE securities, but also federal funds sold, commercial papers and negotiable certificates of deposit) and financial instruments issued by residents of rural communities and by ACAs (“Loan, notes, sales contracts, and leases”). Figure 19.32 shows that in 2016 about two-third of the $220 billion of credit provided by FCS Banks goes to ACAs, while the rest is direct credit to rural communities mostly for production, for agricultural cooperatives, and for infrastructure. Their main liabilities are $259 billion of FCS securities. Similar to Treasuries, FCS securities are generally recorded, and transferred, via electronic entries at the Federal Reserve. FCS Banks have accounts at the Federal Reserve and they use this payment system to make payments to private banks, service debt on their securities, among others.

Table 19.1. The unconsolidated balance sheet of the four Farm Credit System Banks, 2016
Source: Farm Credit Administration
Note: There are four System Banks: AgFirst FCB in Columbia, SC; AgriBank, FCB in St. Paul, MN; CoBank, ACB in Denver, CO; and FCB of Texas in Austin, TX.
Note: “Cash” includes actual cash but also, checks in the process of collection, accounts due from domestic and foreign private depository institutions, and account “balances of all types, and for all purposes, due from Federal Reserve banks (e.g., funds held at Federal Reserve banks for payment of interest on consolidated and Systemwide bonds, purchase of securities, redemption of called consolidated and Systemwide bonds, clearing and working balances, etc.).”
Source: Farm Credit Administration (View FCS Institutions)
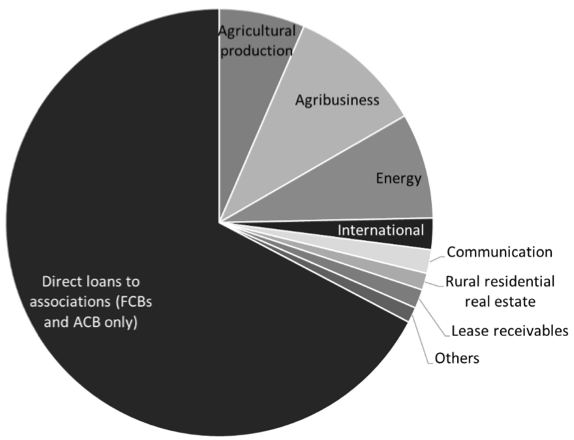
Figure 19.32 Type of credit provided by the Farm Credit System Banks, unconsolidated, 2016
Source: Farm Credit Administration (View FCS Institutions)
Note: Credit for agricultural production includes real estate mortgages issued to finance productive capacities (to purchase farm real estate, to refinance existing mortgages, or to construct various facilities used in operations), as well as credit obtained to buy equipment and for business operations.
The Federal Home Loan Bank System
The Federal Home Loan Bank System (FHLBS) is also organized on similar premises as the Federal Reserve System. It is much more similar to the Federal Reserve System than the FCS because the FHLBS issues monetary instruments and has its own payment system. It was established by the Federal Home Loan Bank Act of 1932 with the goal of promoting homeownership and community development. FHLBS is composed of eleven Federal Home Loan Banks (FHL Banks) that each oversees a district (Figure 19.33). FHL Banks are for-profit companies that are owned by members of the System. This System was first set up for Saving and Loans Institutions but, since 1989, all federally-insured depository institutions (thrift institutions, commercial banks and credit unions), insurance companies, and a few others (such as real estate investment trusts and finance companies) can join if they wish. Today, over 80 percent of members are commercial banks and credit unions, and 90 percent of all commercial banks are members of the System (Table 19.2). Membership is voluntary and requires the purchase of stocks of the FHL Bank of the district in which the financial institution operates. The stocks are not tradable, cannot be pledge as collateral, must be held at face value, pay a dividend, and provide a voting right to elect the director of the FHL Bank of the district. The Office of Finance is the fiscal agent of the System. It does the accounting and oversees the issuance, redemption and servicing of FHLB securities. The system is regulated and supervised by the Federal Housing Financing Agency.

Table 19.2. Members of the Federal Home Loan Bank System, 2016
Source: Office of Finance of the Federal Home Loan Bank System (Federal Home Loan Banks, Combined Financial Report for the Year Ended December 31, 2016), Federal Reserve Bank of St. Louis (FRED), and Credit Union National Association (Credit Union Reports), Insurance Information Institute.
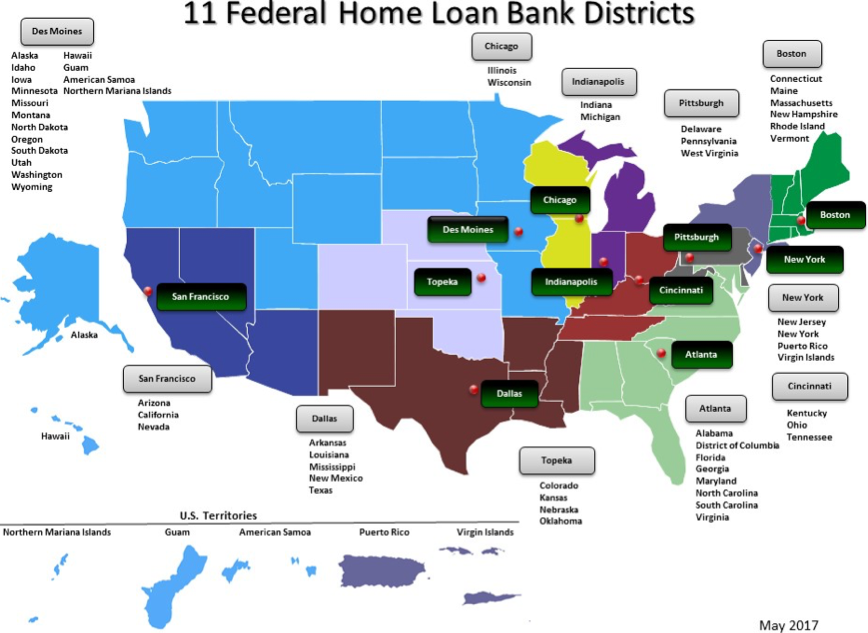
Figure 19.33 The Federal Home Loan Bank System as of May 2017
Source: Federal Housing Financing Agency
The purpose of the FHLBS is to provide its member a stable and low-cost source of funds. The way this is done can be understood by studying the consolidated balance sheet of the FHL Banks (Table 19.3). The main asset is “advances” that were worth $705 billion. Advances represent financial instruments issued by members to the FHL Banks. In exchange, FHL Banks provide credit and payment services in the same way private banks and the Federal Reserve do (See Post 4 and Post 10).
FHL Banks compete among each other and with other financial institutions to provide credit to its members, so each FHL Bank try to accommodate the financial needs of their members as much as possible. FHL banks do so by accepting advances with widely different financial characteristics. Advances can vary in terms of term to maturity (overnight to 30 years), interest rate (fixed or variable), collateral, among others. About 40 percent of advances have to be repaid within one year, and slightly more than half of all advances have to be repaid within two years (Figure 19.34). Revolving lines of credit can also be open—think credit card—that allow a member to continuously get access to FHLB credit.

Table 19.3 Federal Home Loan Banks consolidated balance sheet
Source: Office of Finance of the Federal Home Loan Bank System (Federal Home Loan Banks, Combined Financial Report, for the year ended December 31, 2016)
Note: “Cash and due from” represent cash, accounts at commercial banks, and accounts at the Federal Reserve Banks.
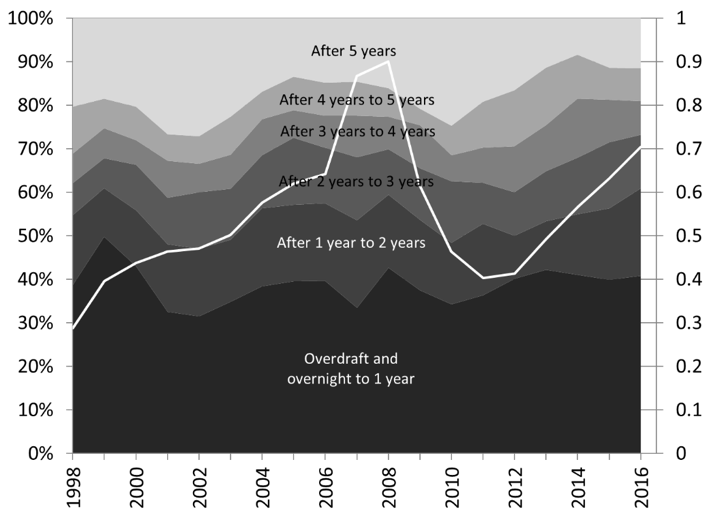
Figure 19.34. Outstanding advances (trillions of dollars) and term-to-maturity structure (percent)
Note: Overdrafts on demand accounts held by members at FHL Banks automatically lead to an advance
The FHL Banks only accept the financial instruments of their members if they are secured by collateral that are consistent with the mission of the FHLBS. The Federal Home Loan Bank Act limits the type of collateral FHL Banks can accept to certain securities, residential mortgage loans, cash, deposits with the FHL Banks, and other eligible real estate-related assets. Community development financial institutions may also pledge as secured financial instruments issued to them by small businesses, small farm, and small agri-business. Figure 19.35 shows the type of collateral accepted by the FHL Bank of New York. In addition to a collateral requirement, federally-insured members must at least have 10 percent of their assets in the form of residential mortgages to be granted credit by FHL Banks. Put differently, before getting access to FHLB refinancing channels, members have to show that they have granted credit to fund economic activities that are consistent with the mission of the FHLBS.
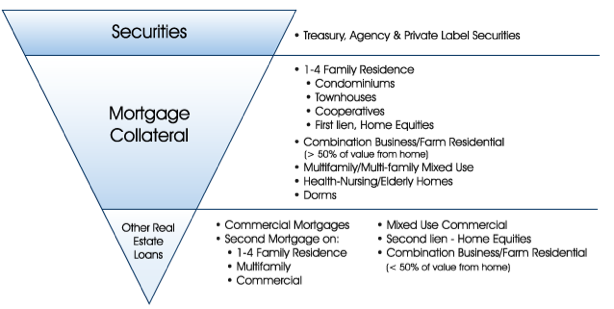
Figure 19.35. Types of collateral accepted by the Federal Home Loan Bank of New York
Source: Federal Home Loan Bank of New York
To fund its operations, that is to obtain the funds it needs to settle payments with other financial institutions and with its members (see Post 10 on interbank payments and reserve requirement for an application to the banking system), FHL Banks must obtain either federal funds or, if the institutions to whom they must transfer funds do not have an account at the Federal Reserve, funds on a private bank account. To obtain these funds the FHL Banks issue financial instruments.
For example, a FHL Bank can attract federal funds when other FHL Banks, commercial banks and government institutions deposit federal funds (monetary assets of the FHL Bank go up) and get credited the equivalent dollar amount on a FHLB account (liabilities of the FHL Bank go up). FHLB accounts can be demand accounts or term accounts, and overdraft is possible on demand accounts and lead to an automatic advance to replenish the account. FHLB accounts can be used to make payments among members, that is, the System has its own payment system that is an alternative to the Federal Reserve payment system and the payment system of private depository institutions. Most FHLB accounts are overnight or demand accounts so the FHL Banks are required to keep an equivalent dollar amount—$8 billion in 2016—of short to medium term to maturity financial assets to avoid liquidity problems. These assets can be cash, federal funds, demand accounts at private banks or FHL Banks, short-term repurchase agreements, Treasuries and agency securities that mature in less than 3 years, among others.
Deposits are, however, a marginal funding source. The two main means to obtain funds are short-term FHLB securities (“discount notes”) and long-term FHLB securities (“bonds”) that together amount to almost $1 trillion. FHL Banks issue these securities in domestic and global financial markets, and compete with the U.S. Treasury, other GSEs, corporations and other issuers of debt securities to find willing bearers. Figure 19.36 shows how the FHLB operates within the financial system. “Lenders” refers to FHLBS members (see Table 19.2) that accept mortgages from “borrowers” (households and businesses) who purchase of real estate. Once they have accepted mortgages, FHLB members have illiquid long-term assets (mortgages) on their balance sheet, while they have immediate needs for federal funds to make payments to their creditors. As explained in Post 10, there are many means to obtain these federal funds and the FHL Banks are one of them. FHL Banks themselves obtain federal funds by issuing securities.
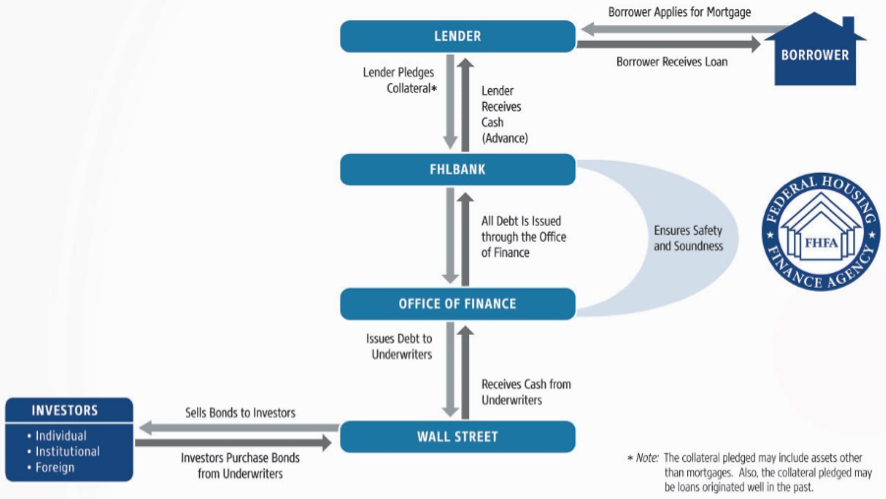
Figure 19.36 How the Federal Home Loan Bank System works
Source: Federal Housing Financing Agency
Figure 19.36 may be potentially misleading in several ways to the reader of this text. It may seem that the whole system is an intermediation between “investors” and “borrowers,” with the investors (the buyers of FHLB securities) being the source of the funds that are then lent to the borrowers (households and businesses) via the help of FHL Banks and “lenders” (FHLB members). This is not the case. As explained in details in Post 10, there is no intermediation at play. Borrowers do not receive cash from investors, in fact they never see any funds, and banks (the “lenders”) do not lend cash. Banks also do not wait for funds obtained by the FHL Banks from investors to accept mortgages from households and businesses. In fact, banks must accept mortgages first before they can get access to FHLB refinancing channel. The point of FHLB is not to provide credit to households and businesses, it is merely to provide an alternative source of federal funds for its members and a convenient means to make payments among its members.
Commercial banks have other means to obtain federal funds so one may wonder why they would come to the FHLBS. Given their size and given the implicit backing of the federal government, there is a high demand for FHLB securities and so FHL Banks are able to issue securities at relatively lower cost. As such, the interest rate FHL Banks pay on their liabilities is lower than that of their members. Given their cooperative structure, FHL Banks pass the lower cost of their liabilities to their members by granting credit are a lower cost than what members may be able to get if they tried to get credit on their own.
The interest rate charged on advances is slightly higher than the interest rate on US Treasuries of similar maturity, and interest rates on Treasuries are among the lowest at a given time for a given maturity. This is important especially in time of crises because interest rates on private financial instruments tend to rise steeply as the number of potential bearers dwindle and the demand for safe assets, such as Treasuries, rises. For members, revolving advances have proven to be a reliable substitute to federal funds market and security repurchase agreements to obtain federal funds, and, in times of stresses, advances from the FHLB tend to be a preferred means to obtained funds. During the savings and loans crisis of the mid-1980s, advances to thrifts peaked at $150 billion in 1988 (Figure 19.37). During the Great Recession, advances to members peaked almost at $1 trillion in 2007 and 2008, with commercial banks asking for the bulk of the $600 billion obtained by U.S. chartered depository institutions in 2008.
Thus, members can obtain loans of federal funds from FHL Banks at a more stable and lower cost than would otherwise have been the case. They can also obtained those funds for a much longer period than alternative wholesale sources. This helps them to lower the interest rates they charge to their customers; homebuyers, small businesses, farmers and others. Lowering the cost of getting credit for homeownership and community development helps to promote these economic activities; precisely the goal of the FHLB.
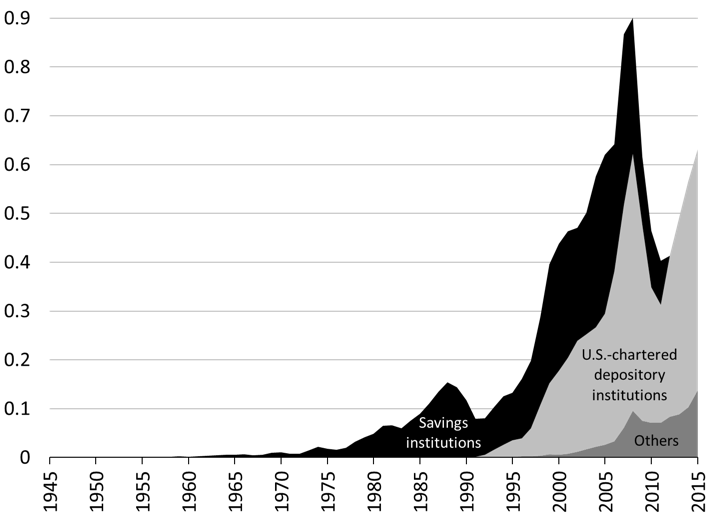
Figure 19.37. FHLB advances (trillions of dollars)
Source: Board of Governors of the Federal Reserve System (series Z.1, part of L.216)
Note: In 2012, the “savings institutions” sector was merged with U.S.-chartered depository institutions


