
Erratum on Post 18: Figure 18.10 has reversed proportions: about 30 percent are issued by nonfinancial corporations.
Note: As I was afraid it would happen, someone emailed me to take issue with the way I use the term promissory note. “Promissory note” has a specific meaning in the law—it is a specific type of financial instruments—but Post 18 uses the term conceptually to mean any formal promise made by someone—a synonymous to financial instrument—, which may create some confusion. I am trying to find an alternative terms that contains the word “promise” (maybe promissory paper?, promissory contract? Contractual promise?) any suggestion welcome. For the moment, I will use the terms financial instrument, or promise…maybe that is good enough…
Financial Companies
Financial companies are involved in creating, buying, selling, and pricing financial instruments. Given the multitude of financial instruments that carry different sorts of risks, and given the complexity involved in issuing and trading financial instruments, financial companies tend to specialize in some specific aspects of the financial sector:
- Activities surrounding marketable financial instruments: the creation and maintenance of a market in which securities can trade requires many resources. Some companies specialize in the provision of such resources. They determine the rules for quoting securities, trading securities, issuing new securities and many other aspects necessary to make trading smooth. Other companies focus on ensuring that issuance can be done properly and that issuers continuously meet the requirements of the platform.
- Providing opportunities to diversify asset portfolios: some financial companies provide opportunities for economic units with a surplus of funds to pool funds to buy financial and nonfinancial assets that provide higher rates of return.
- Promoting specific economic activities that are deemed socially beneficial but riskier and/or less profitable: private companies and government work together to provide low cost sources of funds to specific economic units.
- Risk management and evaluation: some financial companies provide opinions about the creditworthiness of issuers of financial instrument to determine which economic activity is viable, and to guide the asset-portfolio decisions of financial market participants (what to buy, what to sell).
- Providing and managing a payment system: a smooth economic system requires that payments be done efficiently and reliably.
The specific functions performed are reflected into the structure of the balance sheet of each financial institution. Their asset portfolio, i.e. the type of assets they hold, will contain more or less liquid, more or less long-term, more or less secured, financial instruments. The structure of their liabilities will contain a different proportion of contingent liabilities (claims that are due if an event happens, such as, an accident or retirement), demand liabilities (claims that are due whenever claimants require it, such as, withdrawals of cash from checking accounts, or the repurchase of shares on demand), and dated liabilities (claims that are due after a certain time, such as the capacity to withdraw funds from a pension plan after a certain time, or the requirement to pay interest periodically).
Maintaining Solvency: Profitability and Liquidity
All for-profit financial companies ultimately have two core objectives. One is profitability, that is, ensuring that a company can generate an income greater than its expenses so that it can accumulate some net worth overtime. Another is liquidity, that is, ensuring that enough cash and other liquid assets are available at any time to meet immediate payments due to creditors. For-profit companies must meet these two objectives to maintain their solvency, that is, their ability to pay creditors in a timely fashion. Put differently solvency can be judged in two ways:
- Cash-flow solvency: The capacity to acquire positive net cash inflows
- Balance sheet solvency: The capacity to generate a positive net worth so that if cash inflows are insufficient one can repay creditors by selling assets.
For example, if a commercial bank is facing a bank run—many of its customers are lining up at the same time to cash out their bank account—there are several possible outcomes depending on the structure of the balance sheet of the bank:
- Case 1: The balance sheet looks like this:

There is no net worth in the bank but all the assets are liquid. The bank is liquid today (and so it can respond to the run) but is not profitable. The bank is solvent today but insolvent in the future because the bank cannot pay its daily expenses such as salaries and electricity.
- Case 2: The balance sheet looks like this:
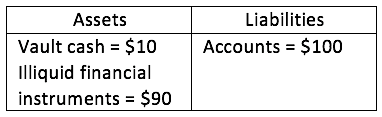
There is no equity in the bank and most financial instruments are illiquid: the bank is illiquid (it cannot respond on its own to the run) but it is potentially profitable (illiquid financial instruments pay an interest income). A run makes the bank insolvent today although the bank is solvent in the future if given some time, because it will receive income and will build equity.
- Case 3: The balance sheet looks like this:
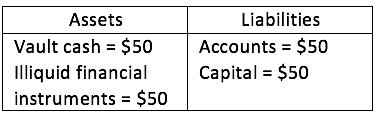
There is some equity and the bank is profitable and has enough liquid assets: the bank can meet the run on its own and be profitable overtime.
The necessity to stay solvent will lead to a different structure of assets given the structure of liabilities. For example, a financial company will need to keep more liquid assets if it has a high proportion of demand liabilities and/or highly unpredictable cash outflows. As such, banks, that have a high proportion of demand liabilities, must keep more cash on hand than pension funds that have a high proportion of long-term dated liabilities and highly predictable cash outflows.
The following sections review the main characteristics of different financial companies and illustrate them by using mostly the Financial Accounts of the United States. The Financial Accounts aims at measuring the outstanding, and change in the, dollar value of nonfinancial assets, financial assets, financial liability, and net worth of many different sectors of the economy. This goal is achieved imperfectly because the dataset relies on many sources of data that are imperfect, incomplete, and that rely on surveys and estimations. The Financial Accounts also ignores some assets, such as land or coins, and do not capture well what goes on in some corners of the financial sector because many of these activities are off-balance sheets and/or unregulated, and so limited, or no, data is available. The dataset is also constantly changing with some sectors and some instruments added or removed. Despite its limitations, the Financial Accounts of the United States provide invaluable information about the financial states of different economic sectors, and it is a core dataset for economic analysis.
Private Depository Institutions: Commercial Banks and Thrifts
Private depository institutions are financial companies in which one can open checking accounts. These accounts give access to the payment system of private depository institutions—account holders can make payments to someone else who has an account at any private depository institution—and are convertible into cash on demand. These financial companies are commonly known as “banks” and they provide the following financial services:
- Credit services: Evaluate the creditworthiness of deficit-spending economic agents through screening (i.e. selection) and monitory (i.e. supervision).
- Payment services: Settle debts, transfers of funds, provision of monetary instruments that can be used on banks’ payment system.
- Retail portfolio services: Provide portfolio management opportunities for savers to earn better interest rate on savings.
In order to operate as a bank, depository institutions must obtain a charter that allows them to operate either in a state (state bank) or on the entire territory (national bank). Posts 8 through 10 examine the operations of banks in much more in details.
Commercial Banks
U.S. Congress gave the first national charter to the Bank of North America in 1781 in Pennsylvania. Commercial banks specialize mostly in fulfilling the financial needs of small businesses and households. Figures 19.1 to 19.3 provide details about the volume and structure of the balance sheet of FDIC-insured commercial banks since 1934. During World War Two, private depository institutions were asked to help finance the war through large purchases of Treasuries and the Federal Reserve ensured that they had the means to do so throughout the war (Post 6). Consequently, the proportion of Treasuries rose from 20 percent of assets to 55 percent by the end of the war. After WWII, commercial banks returned to fulfilling the financial needs of private economic units. The proportion of mortgages in the portfolio of banks rose progressively to peak at 30 percent of assets prior to the Great Recession. Consumer, industrial, and commercial credit (that is non-marketable financial instruments that are not mortgages and that are issued by households and businesses) have also consistently represented about a third of the asset portfolio of banks.
With the rise of wholesale funding sources (see Post 4), federal funds loans and security repurchase agreements (RPs) have grown as a proportion of the assets of banks and peaked at 15 percent of assets prior to the Great Recession. The proportion of cash and accounts held by commercial banks (“due from”) shrank from 25 percent of all assets after World War Two to 5 percent right before the Great Recession, but represents today about 10 percent of all assets following emergency monetary policy during the Great Depression. The book value of outstanding assets was worth $15 trillion in 2015. The book value equals the face value of financial instruments less amortization (repayment of principal) plus the purchased price of non-financial assets less depreciation (an accounting measure of the expenses due to wears and tears). The book value is different from the market value of assets, the price at which the assets could be sold at any given time.
Liabilities of commercial banks consist mostly of accounts due to the private domestic sector, which have represented at least 60 percent of their liabilities. Accounts issued to domestic governments and foreign entities used to add another 20 percent to liabilities but since the mid-1980s their importance has shrunk considerably to about 5 percent of liabilities. In their place, “borrowed funds” have grown in importance since the 1960s, marking the growth wholesale funding sources for banks. The proportion of demand, savings, and time accounts have varied widely since 1934 and today savings accounts represent 70 percent of all accounts out of the $10 trillion outstanding.
Overall, while commercial banks accept long-term illiquid financial instruments (20 percent of their assets are mortgages), their assets consists mostly of short-to-medium term maturity or relatively liquid financial instruments (Treasuries, cash, consumer and business credit, fed funds loans). This is necessary given the nature of their liabilities that are mostly due on demand or on a short-term basis (demand and savings account, fed funds debt, among others). Commercial banks usually do not have to keep much cash in their vault because withdrawals in retail bank accounts tend to be highly predictable, and because cash does not earn any interest income, but some liquid safe assets are kept in significant proportion. The greater reliance on wholesale source of funds has increased the need to stay liquid because withdrawals and transfers are much less predictable from these sources of funds.

Figure 19.1. Structure (percent) and level (trillions of dollars) of the assets of FDIC-insured commercial banks
Source: Federal Deposit Insurance Corporation (Historical Statistics on Banking, Tables CB09 to CB13)
Note: “Other types of credit” include various items that have changed overtime such as unplanned overdrafts and advances to brokers and dealers in securities, any debtor for the purpose of purchasing and carrying securities, and credit to nonprofit institutions and organizations, real estate investment trusts, mortgage companies, holding companies of depository institutions, insurance companies, finance companies, foreign governments and official institutions, churches, among others.
Note: “Other securities” includes corporate bonds, corporate equities, among others.
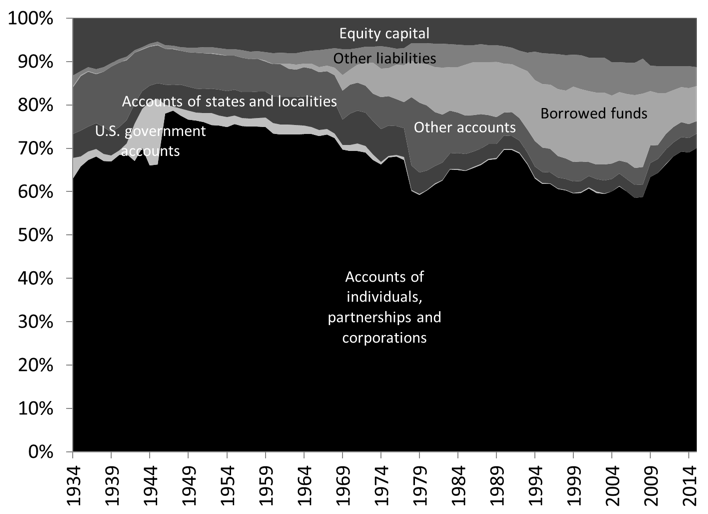
Figure 19.2 Structure of liabilities of FDIC-insured commercial banks
Source: Federal Deposit Insurance Corporation (Historical Statistics on Banking, Tables CB14, CB15)
Note: “Other accounts” represents mostly accounts of foreign and domestic financial institutions and accounts of foreign governments and official institutions.
Note: “Borrowed funds” represents federal funds purchased (that is borrowed), securities sold under agreements to repurchase, demand notes issued to the US Treasury, mortgage indebtedness, liabilities under capitalized leases and all other liabilities for borrowed funds. From 1934 to 1968 borrowed funds does not include mortgage indebtedness, which is netted against bank premises.
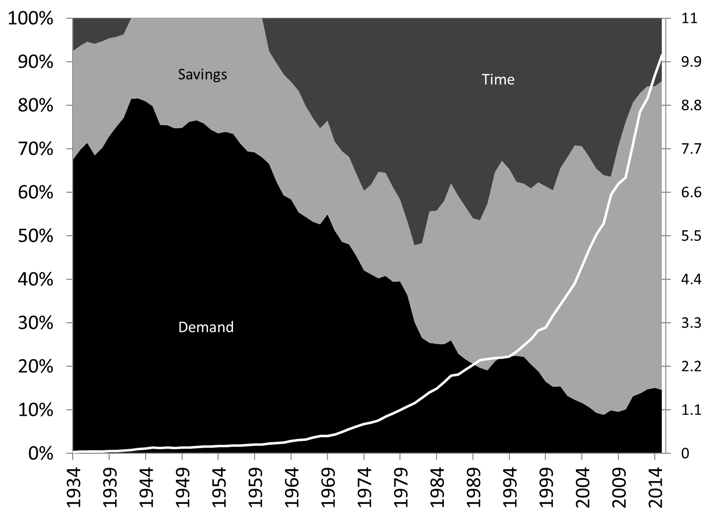
Figure 19.3 Structure (percent) and outstanding dollar amount (trillions of dollars) of bank accounts
Source: Federal Deposit Insurance Corporation (Historical Statistics on Banking, Tables CB14, CB15)
Thrift Institutions
Savings Institutions
Savings and Loan associations have existed since the 1830s and were first known as “building and loan associations.” The initial business model of savings institutions consisted in holding mortgages issued by households and businesses, and encouraging thrift by providing interest-earning bank accounts. Prior to 1980, there were important differences with commercial banks such as:
- A cap on the interest rate they could pay on savings accounts that was higher than commercial banks (Regulation Q)
- They could not offer checking accounts
- They were restricted on the assets they could hold; mostly mortgages and safer assets.
The sector was deregulated in the 1980s following changes in monetary policy practices in the 1970s that made the initial business model of savings banks unprofitable. Large risk taking and fraudulent activities followed as savings institutions to try to return to profitability, which led to the Savings and Loan crisis in the late 1980s. The sector was hit by high credit risk and the value of its financial assets felt by $600 billion (Figure 19.4). The sector was hit again hard by the mortgage crisis during the Great Recession, after which the outstanding value of assets was the same as in 1985 ($1.3 trillion).
Like commercial banks, by the end of WWII, Treasuries represented 50 percent of the financial assets of savings institutions. With the rise of homeownership after the war, residential mortgages once again became a large proportion of the asset portfolio of savings institutions, and by 1980 mortgages of all sorts represented 80 percent of all financial assets. After 1980, agency securities, corporate and foreign bonds as well as consumer, industrial and commercial credit grew from about 10 percent of assets to 30 percent of assets.
Time and savings accounts have always been the overwhelming liability of savings institutions, especially so prior to 1980 when they represented usually over 90 percent of liabilities (Figure 19.5). After 1980, checking accounts and individual retirement accounts (IRAs) grew in proportion to 10-15 percent of liabilities. Debts owed to GSEs (Federal Home Loan Banks and Sallie Mae) also became a significant proportion of the liabilities of savings institutions. Contrary to commercial banks, savings institutions do not rely much on the federal funds market to borrow funds.
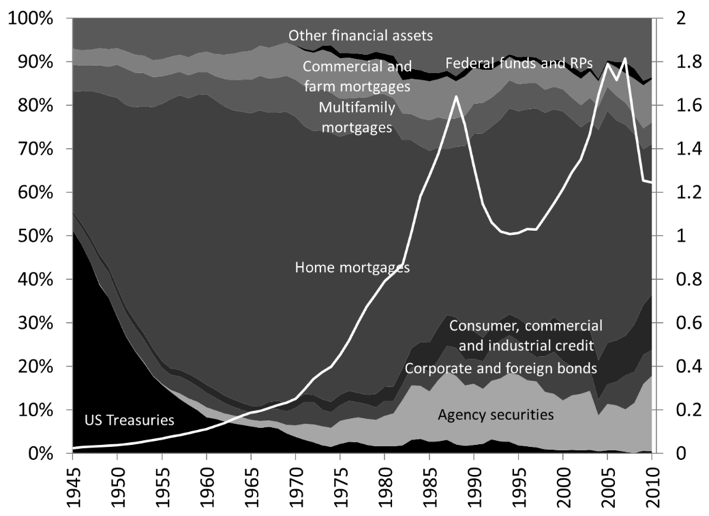
Figure 19.4. Structure (percent) and level (trillions of dollars) of savings institutions
Source: Board of Governors of the Federal Reserve System (Series Z.1, previously L.114)
Note: Savings institutions include state-chartered savings banks, federal savings banks, cooperative banks, and savings and loan associations. The sector “savings institutions” was discontinued from the Financial Accounts at the end of 2011 due to filing regulatory changes and was merged with U.S. chartered depository institutions, which are part of commercial banks.
Note: “Other financial assets” includes corporate equities, checkable deposits, time and savings deposits, reserves, municipals, commercial papers, among others.
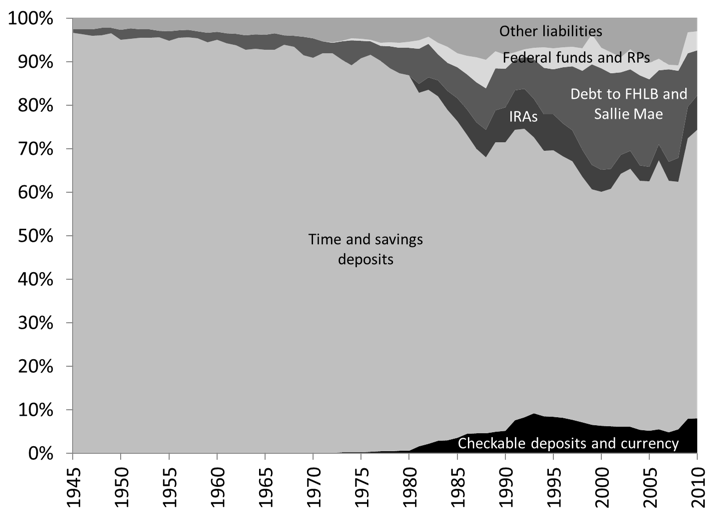
Figure 19.5. Structure of the liabilities of savings institutions
Source: Board of Governors of the Federal Reserve System (Series Z.1, previously L.114)
Note: “Other liabilities” include taxes payable, bank advances not classified elsewhere, corporate and foreign bonds, among others.
Credit Unions
Determining the creditworthiness of a client is costly, especially for those who have never had access to prior credit and have limited income and asset. In addition, the risk of losses for a bank are intrinsically greater if the amount of collateral available is limited or inexistent. Consequently, traditional banks are reluctant to provide credit to poor, small and rural economic units. Credit unions emerged in the 1910s in the United States to service the credit needs of economic units that were not served well by commercial banks.
Credit unions perform similar services as the thrifts and commercial banks but credit unions are local cooperative, non-profit, tax-exempt associations. Given their non-profit nature, compared to traditional bank they can offer a slightly higher rate on savings account and a slightly lower rate when granting credit. However, their business model is mostly localized and may not fit the needs of customers that operate nationally or internationally. In addition, contrary to commercial banks and savings institutions, not everyone can become a customer of a credit union. The law requires that a credit union defines a field of membership, that is, that it states what the common bond is between its members. That common bond can be narrow or broad depending on how the credit union is set up; a common employer, a church, living is certain local counties, among others, are common criteria.
Figure 19.6 shows that the outstanding value of their assets was $1.2 trillion in 2015. Contrary to savings institutions, they were not hit by the Great Recession; the non-profit nature of credit unions did not push them to lower their credit standards to reach a profitability target. While credit unions did buy some Treasuries during World War Two, this financial instrument never became more than 25 percent of their financial assets. After the War, the financial assets of credit unions mostly consisted of mortgages, but they rapidly specialized in providing consumer credit. In the 1990s, home mortgages (single-family housing mortgages and home equity line of credit) grew again as a proportion of financial assets from 10 percent to over 30 percent. Agency securities also became significant assets during that period to reach about 20 percent of their financial assets. Their main liabilities have been quite similar to savings institutions, with time and savings accounts as the main liability and individual retirement accounts (IRAs) and checking accounts gaining in importance in the 1980s. Credit unions have relied on the federal funds market even less than savings institutions (Figure 19.7).
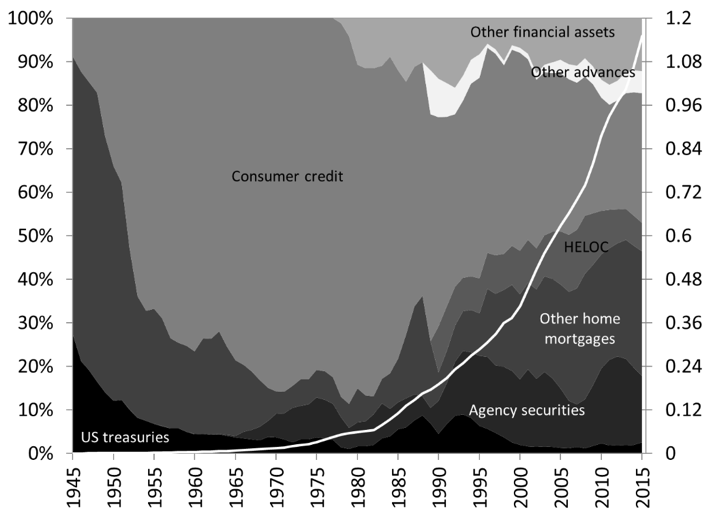
Figure 19.6. Structure (percent) and level (trillions of dollars) of the assets of credit unions.
Source: Board of Governors of the Federal Reserve System (Series Z.1, L.114)
Note: “Other financial assets” includes federal funds sold and repurchase agreements, municipal securities, corporate and foreign bonds, and commercial papers, among others.
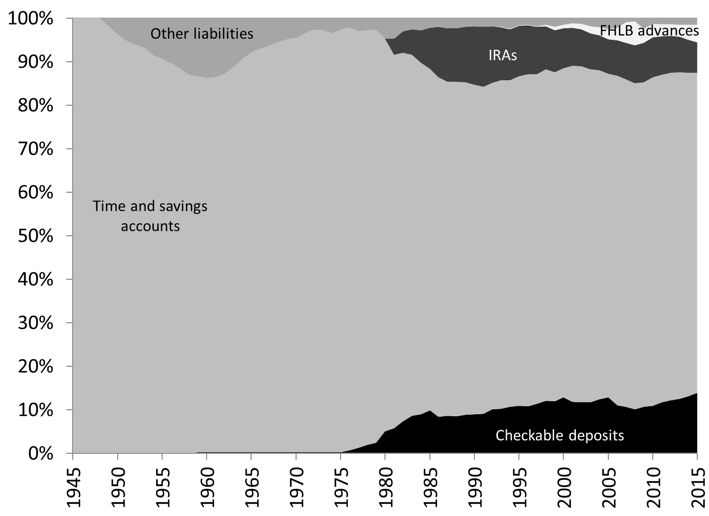
Figure 19.7. Structure of the liabilities of credit unions
Source: Board of Governors of the Federal Reserve System (Series Z.1, L.114)
Note: “Other liabilities” includes federal funds and repurchase agreements, among others.
Insurance Companies
Insurance companies issue policies that promise to provide protections against specific contingencies (probable events) that adversely impact the balance sheet and income of an economic unit. Retirement leads to a loss of income, an earthquake destroys a house, a car crash leaves someone without a car and badly injured, the death or illness of a spouse leaves other family members in poverty. Economic units who want financial protection must pay a periodic premium that is a main source of income for insurance companies. This business model is profitable as long as contingencies—and so payouts to affected insured economic units—are not too frequent nor too severe. In order to ensure that this is the case, insurance companies protect themselves by screening and monitoring policyholders, and by ensuring that customers have something to lose if they do not behave properly once they are insured. Insurance companies by also insure themselves.
In order to avoid adverse selection, that is to avoid attracting mostly high-risk customers (sick individuals, reckless drivers) before a policy contract is signed, insurance companies rely on screening—one must fill up forms asking questions about age, sex, life habits, marital status, family illness, among others—in order to determine the probability of occurrence of the contingency against which a client wants protection. The probability is not established by studying the character of an individual but by relying on statistics. Long-run data shows that motorcyclist have a much higher chance to get in a fatal crash, young male drivers are at higher risk to get in a fatal car crash, someone with a history of cancer running in his family has a higher chance to get cancer, American Indian women have a lower risk of getting breast cancer than white women. Once the screening is done, an insurance company, either will refuse to insure a potential customer because the risk is too high, or will adjust the premium to the risk; young single male driver pay a much higher premium than middle-age married male.
In order to avoid moral hazard, that is, to ensure that insured customers do not become careless once they are insured—thereby raising the probability of a contingency—, insurance companies make sure that its clients have some stake in limiting risk taking. They do so by making sure that if the contingency does occur, the client still has to incur some expenses. One way to do so is to set a deductible, that is, a minimum amount that the client has to pay before reimbursement by the insurance starts. For example, if a medical insurance contract states that the annual deductible is $2000, the sum of medical expenses for the year has to reach $2000 before reimbursement starts. Insurance companies may also require copayments beyond the deductible, that is, payments each time insurance service is requested. Copayments are not counted toward meeting the deductible, only medical expenses are. Finally, an insurance may also require coinsurance, that is, that the clients cover a percentage of any expense beyond the deductible, such as 10 percent of medical expenses beyond $2000.
The reader may note that moral hazard and adverse selection are not limited to insurance companies. They apply to all financial institutions. We will encounter them again in later chapters on banking.
Life Insurance Companies
They emerged in the early 1800s to provide insurance services against loss of income induces by death, disability, old age and other health problems. Cash outflows are highly predictable because probabilities about life expectancy are well established and stable. Therefore, most of the funds earned are placed into less liquid to illiquid assets. Similar to commercial banks, Treasuries used to represent a large proportion of the assets of life insurance companies but that changed rapidly after WWII. Figure 19.8 shows that in 2015, 80 percent of their $6.5 trillion assets are corporate securities and mutual fund shares as well as non-marketable financial instruments. Life insurance reserves (a measure of future payouts to beneficiaries) and pension entitlements were the main liabilities of insurance companies, with pension entitlement representing a growing share of liabilities. Toward the end of the 1970s, life insurance companies started to issue corporate shares that now represent about 5 percent of liabilities.
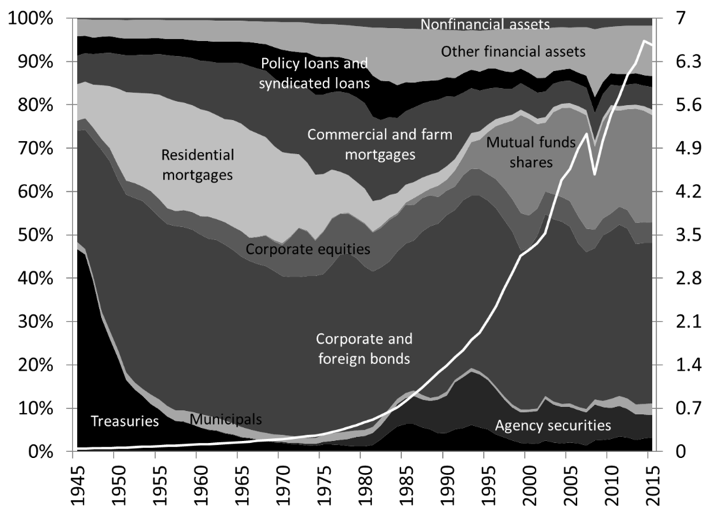
Figure 19.8 Structure (percent) and level (trillions of dollars) of assets of life insurance companies
Source: Board of Governors of the Federal Reserve System (series Z.1, L.116)
Note: “Other financial assets” includes money market mutual funds shares, commercial papers, checking accounts and currency, security repurchase agreements, among others.
Note: Policy loans are loans made by life insurance companies secured by the cash value of a policy. If default occurs, the amount of death benefits is reduced accordingly. Syndicated loans are loans made by a group of creditors to nonfinancial businesses.
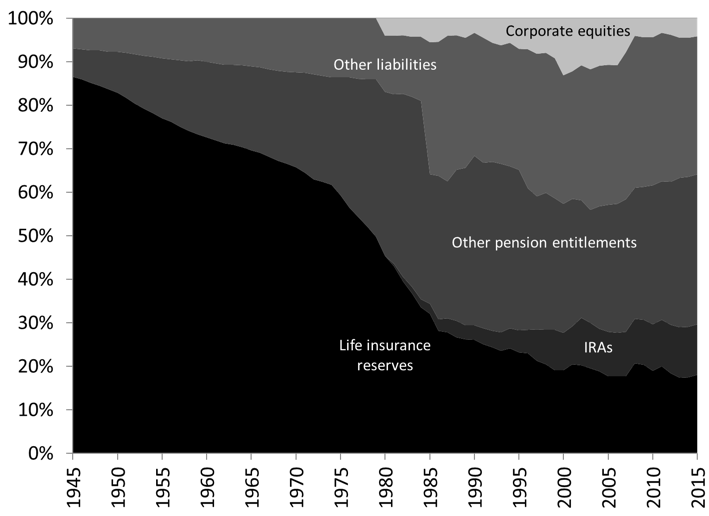
Figure 19.9. Structure of liabilities of life insurance companies
Source: Board of Governors of the Federal Reserve System (Series Z.1, L.116)
Note: “Other liabilities” include security repurchase agreements, taxes payable, among others.
Property and Casualty Insurance Companies
In response to blazes that burned down large cities such as London, several steps were taken to reduce the scope of personal financial losses and to protect physical properties. Fire brigades were organized, building codes were created, and fire insurance companies emerged. In the US, the first fire brigade was created in 1653 in Boston and the first fire insurance companies emerged around 1750s. Today, property and casualty insurance companies protect against a wide variety of events, from accident, to theft, to natural disasters.
The cash outflows of this business model are less predictable because, even though there are statistical regularities, unexpectedly adverse events, such as natural disasters, can happen. As such, property and casualty insurance companies hold more liquid assets than life insurance companies do. In 2015, their assets were worth $2 trillion and were composed mostly of safer securities (Treasuries, agency securities and municipals) (Figure 19.10). Their main liability is the claims customers have on existing policies (Figure 19.11). Corporate shares peaked at 40 percent of liabilities from the mid-1990s to the mid-2000s, but since 2008 they have represented about 20 percent of liabilities.
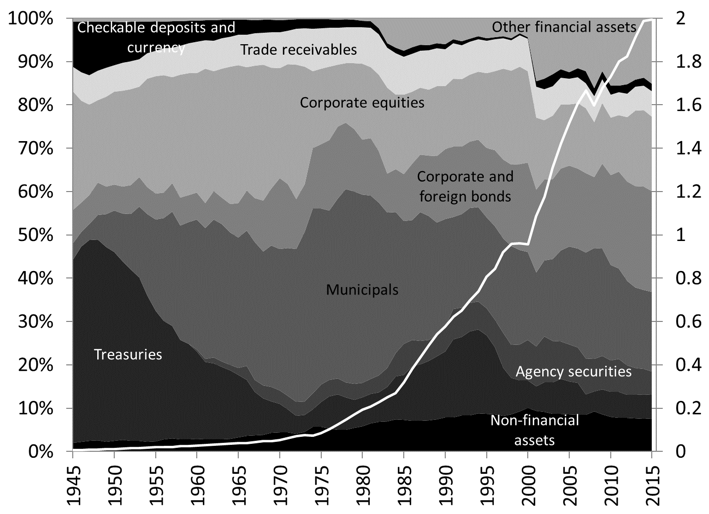
Figure 19.10. Structure (percent) and level (trillions of dollars) assets of property and casualty insurance companies
Source: Board of Governors of the Federal Reserve System (Series Z.1, L.115)
Note: “Other financial assets” includes commercial papers, mutual funds shares, money market mutual funds shares, commercial mortgages, security repurchase agreements, among others.
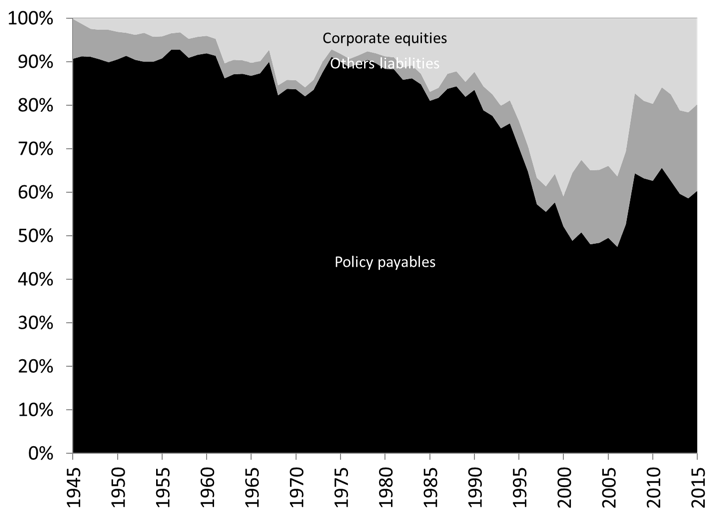
Figure 19.11 Structure of liabilities of property and casualty insurance companies
Source: Board of Governors of the Federal Reserve System (Series Z.1, L.115)
Note: “Other liabilities” includes advances from Federal Home Loan Banks, taxes payable, among others.
Finance Companies
They first specialized in providing credit to customers with a low creditworthiness, but now provide credit to all types of customers. One can put finance companies in three categories:
- Sale finance companies: They are owned by non-financial companies, such as car dealers or department stores, and provide credit to customers.
- Consumer finance companies: They provide credit to individuals with poor creditworthiness (payday loan companies, car title loan companies, subprime mortgage companies, among others).
- Business finance companies: They lease equipment (airplanes, machines) to businesses and provide credit for inventory financing, among others
Most of the assets of finance companies consist of non-marketable financial instruments issued by households and non-financial businesses for consumption purpose (“consumer credit”) and business purpose (“non-financial business credit”). Mortgages gained in importance in the 2000s, as mortgage companies increased the volume of subprime mortgages they accepted, and peaked at 20 percent of financial assets before collapsing to 5 percent of financial assets because of heavy losses during the Great Recession. Corporate and foreign bonds also grew as a share of financial assets in the mid-1990s, and early 2000s to reach 15 percent of financial assets, but fell during the Great Recession, which reflects heavy losses on mortgage-backed securities and related financial instruments (Figure 19.12). Losses on mortgages and related securities led to a fall of the value of financial assets by $400 billion and, in 2015, they were worth $1.5 trillion. Liabilities have been quite diverse given the wide range of activities in which finance companies are involved, but since the late 1980s, the structure of liabilities has moved toward longer-term to maturity. Corporate and foreign bonds have grown in proportion whereas commercial papers and advances from banks have shrunk from 40 percent to 20 percent of liabilities (Figure 19.13).
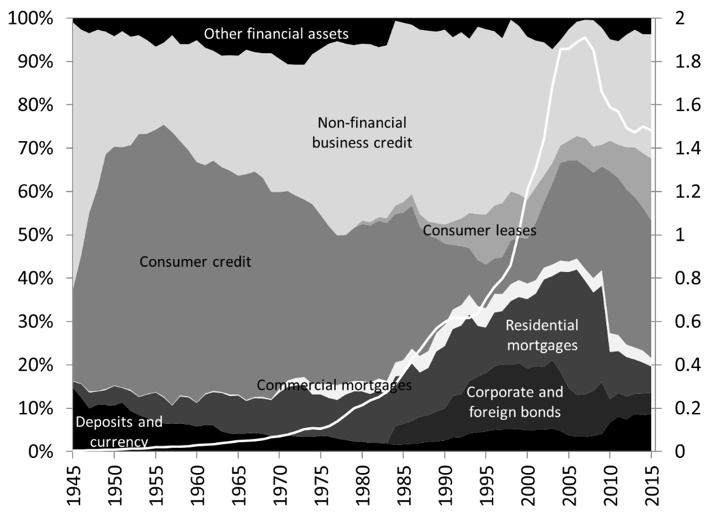
Figure 19.12. Structure (percent) and level (trillions of dollars) of the assets of finance companies
Source: Board of Governors of the Federal Reserve System (Series Z.1, L.128)
Note: The sector includes retail captive finance companies and mortgage companies. Residential mortgages include, home mortgages, home equity lines of credit and multifamily mortgages.
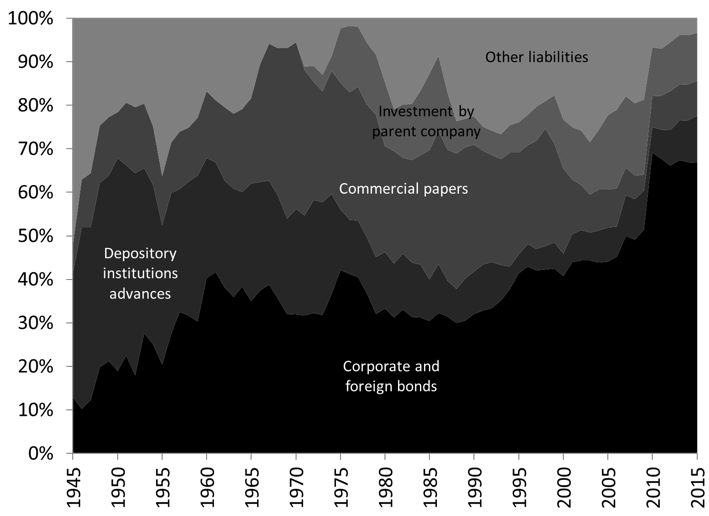
Figure 19.13. Structure of the liabilities of finance companies
Source: Board of Governors of the Federal Reserve System (Series Z.1, L.128)
Note: “Other liabilities” includes advances by the Federal Home Loan Banks, taxes payable, among others.
Financial Investment Companies
There is a wide variety of financial companies that propose to pool and manage funds saved by economic units to buy income-earning and capital-gain-making assets. They vary in terms of the assets they buy, in terms of the liabilities they issue, in terms of their tax status, among others. Pooling funds is beneficial because:
- Small savers may not be able to afford to buy securities in financial markets on their own.
- The absolute return obtain by pooling money together is higher.
- Pooling reduces the cost of financial placements and increases the diversification of portfolios.
For example, bonds usually have a market value close to $1000 so people with a small amount of savings may not be able to afford to buy many of them unless they pool their funds together into a mutual fund. Say Mr. Y has $100 and Mr. X has $900. Alone, none of them can buy a bond, but they can if they pool their funds into a mutual fund. Interest received on the bond will be distributed to X and Y in proportion of the amount of funds provided to the mutual fund. For example, if the interest income received on the bond is $100, Y will receive $10 and Mr. X will receive $90, minus fees paid to the mutual fund.
Pension Funds
Pension funds are tax-exempt institutions that promise to provide an income—called pension—to replace partially or fully the loss of income induced by retirement. Individuals usually get access to a pension fund through their employers, who are the sponsor of the fund. The employers match the contributions employees make to the fund, and provide some financial backing to the fund. Individuals have to make contributions that are used by the fund managers to buy earning assets. The contributions are tax-exempts, that is, no income tax is paid for any part of gross income that is allocated to a pension fund. For example, if an individual’s gross salary is $50,000 and she chooses to put $10,000 in a pension fund, the individual’s income tax will be based on $40,000. The vesting period is the length of time over which one must contribute to a pension fund before one can get a pension (usually 5 years in US).
In the US, the first pension fund was established by New York City for its police force in 1857. There are two forms of pension funds and both can be created by private and government economic units; defined-contribution plans (401(k) plan, 403(b) plan, among others) and defined-benefit plans (Social Security and the California Public Employees’ Retirement System (CalPERS) are the most well-known).
In a defined-contribution plan, the pension received depends on the overall contribution of an individual and the performance of the assets in the pension fund. For example, if by the time someone retires, someone has contributed $1,000,000 to a pension fund and the assets purchased by the fund yield a 5 percent annual rate of return, the annual pension is $50,000. However, the rate of return is not fixed, it depends on what happens to the assets purchased by the pension funds so the pension received is not fixed. Most of those assets are financial assets and Post 18 showed that they are risks involved with them. Some issuers may default, some financial instruments may be illiquid, economic and financial conditions may negatively impact the value of securities. As such, as some retirees learned during the Great Recession, the pension from a defined-contribution plan can dwindle to nothing. Finally, in order for this type of plan to be beneficial, income earners must be able and willing to save during their working years. Many Americans do not have the ability or willingness to do so in a significant fashion.
Defined-benefit plans guarantee a pension that is calculated based on years of work, age of retirement, final salary, among other. For example, if one must work 40 years to get full benefits but merely worked 30 years, and if the salary on the final year is $50,000, the annual retirement benefit will be $37,500 (3/4 of $50,000). One of the main risk involved in such plan is a funding risk, that is, the pension fund and its sponsor may become insolvent. This is a risk for pension funds that are sponsored by entities that are not monetarily sovereign (state and local government pension funds, private pension funds, pension funds of non-sovereign federal governments). The reader probably heard that Social Security will be insolvent soon and so today’s youth should not rely on it (and should in fact be against it). This is not the case given that the US government is monetarily sovereign so finding dollars to pay the benefit is not a problem (see Post 6). As shown below, the U.S. government’s net worth is massively negative but this does not impact its ability to operate smoothly.
Given that defined-benefit plans are more costly and more risky to employers, most private businesses and state and local governments have moved away from sponsoring defined-benefit plans. As such, the funding risk of retirement has been shifted away from employers onto employees. The timing of the cash outflow is well established and the liability is a long-term liability so most of the assets owned are less-liquid long-term assets. In 2015, corporate securities and mutual fund shares represented about 60 percent of the assets of pension funds, and Treasuries have consistently represented about 10 percent of assets since 1945. Early on, 80 percent of the funding of pension funds came from the sponsor’s payments to the funds but today pension funds are much more autonomous and claims on sponsors represent about 20 percent of assets (Figure 19.14). This reflects the move away from defined-benefit plans to defined-contribution plans. The liability of pension funds is called pension funds reserves, which is a function of expected pensions to be paid and must be matched by some assets.
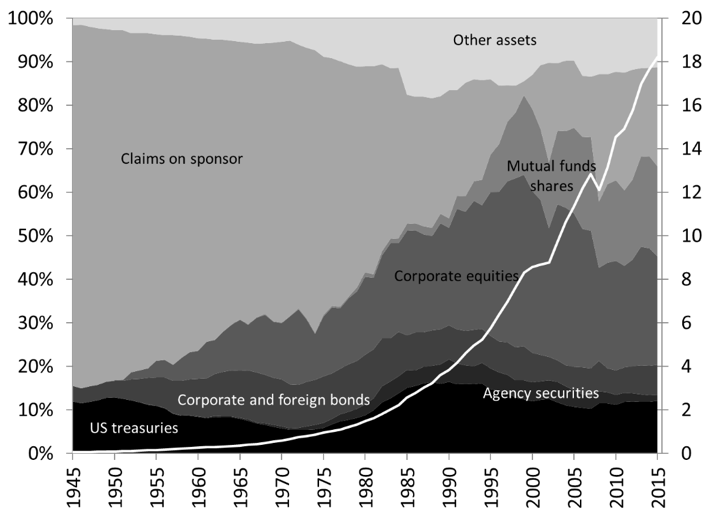
Figure 19.14. Structure (percent) and level (trillions of dollars) of the assets of pension funds
Source: Board of Governors of the Federal Reserve System (Series Z.1, L.117)
Note: “Other assets” includes nonfinancial assets, checking accounts, time and savings accounts, money market mutual funds shares, mortgages, commercial papers, among others.


