
The New York Times made waves this week with another piece on inequality, saying that it has not risen since 2007. The article was based on this paper by GWU’s Stephen Rose.
The article also suggests that expansions are not a good way of looking at trends in inequality (as I have done in the past, also covered by the NYT). Instead, one needs to look at the business cycle. It also concludes that, thankfully, because of government tax and transfer policies, inequality has not been “that bad” over the last few years and governments can clearly do something about it.
So what’s wrong with this picture?
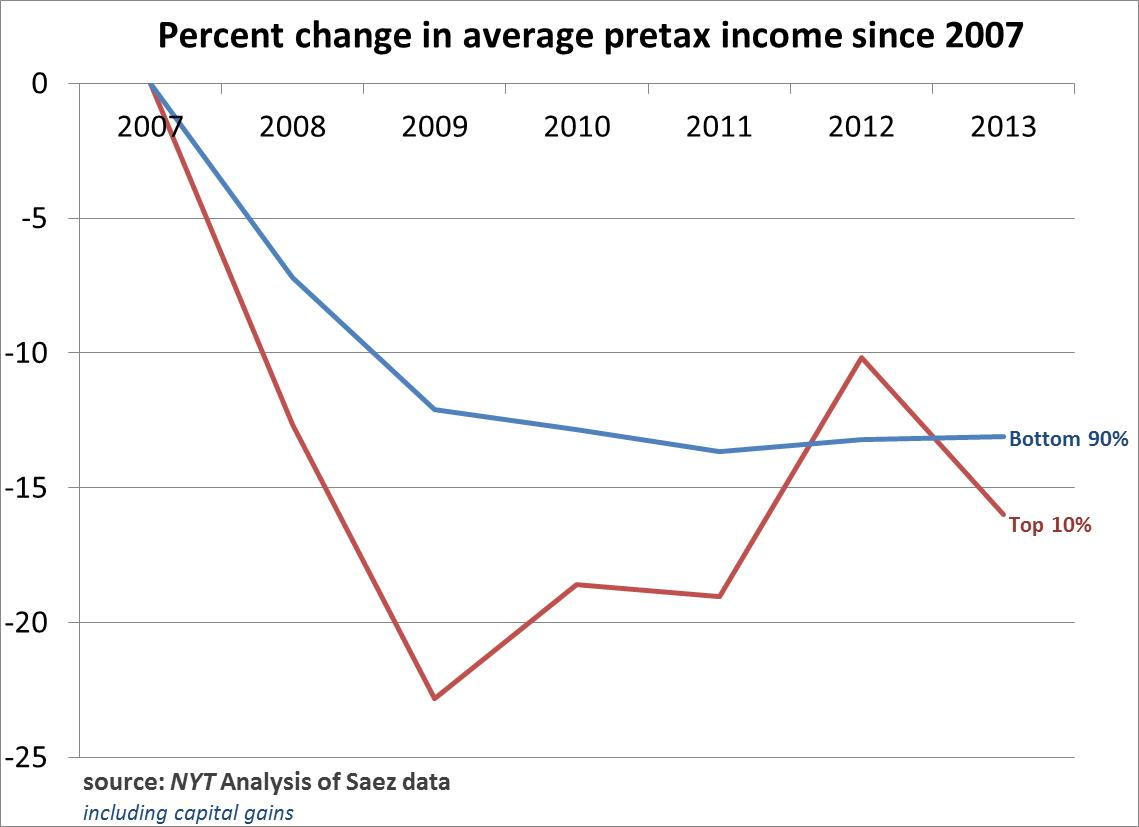
Here is the graph that appeared in the NYT (I’ve reproduced it below showing only the bottom 90% and top 10% of families using the same Saez data).
Now let’s reproduce the exact same graph, using the same data but excluding capital gains. The trends reverse. The bottom 90% of families have lost proportionately more than the top 10% since 2007.
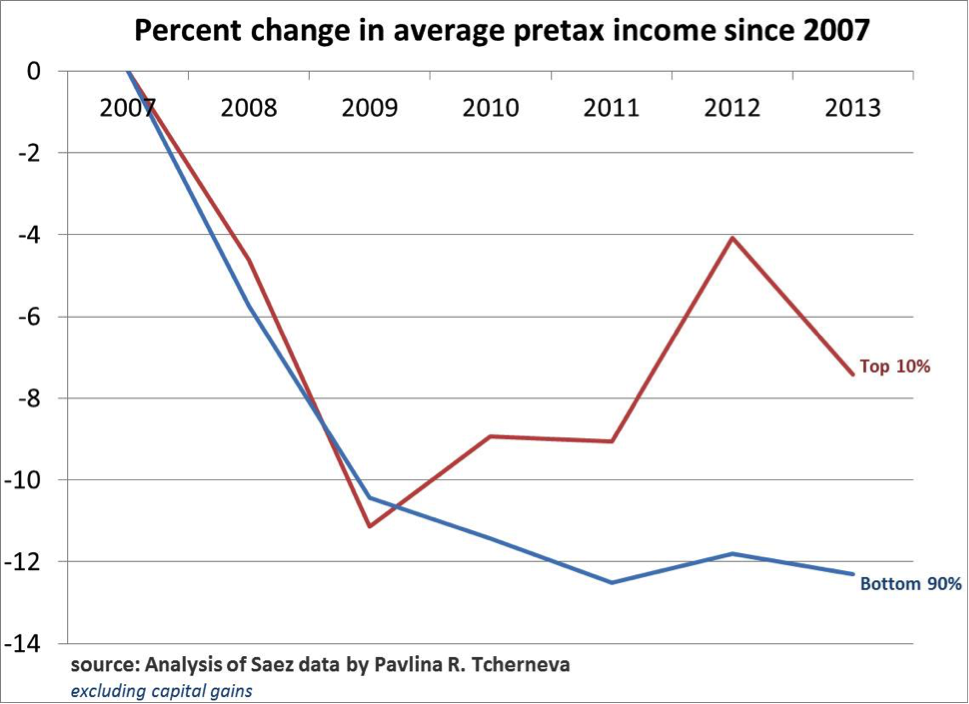
“Now, I am not fond of excluding capital gains (I am in favor of annuitizing them), because they are very important to income dynamics, but still, without capital gains, the bottom 90% lose proportionately more (relative to the top 10%) than with them.
In any case, if we include the top 1% and the 0.01% in the above two charts, one would find that they do lose proportionately more including or excluding capital gains.”
In any case, if we include the top 1% and the 0.01% in the above two charts, one would find that they do lose proportionately more including or excluding capital gains.
However, the bottom line is this: this exercise gives an extremely narrow look at income distribution trends, based on a very incomplete picture. As Nick Bunker from the Washington Center for Equitable Growth put it:
“Reasonable people can disagree about the best benchmark. But what isn’t reasonable is using a peak as a benchmark to claim inequality hasn’t increased over an incomplete business cycle.”
So let’s look at complete business cycle data. The following chart shows how the distribution of income growth has evolved from one peak to another.
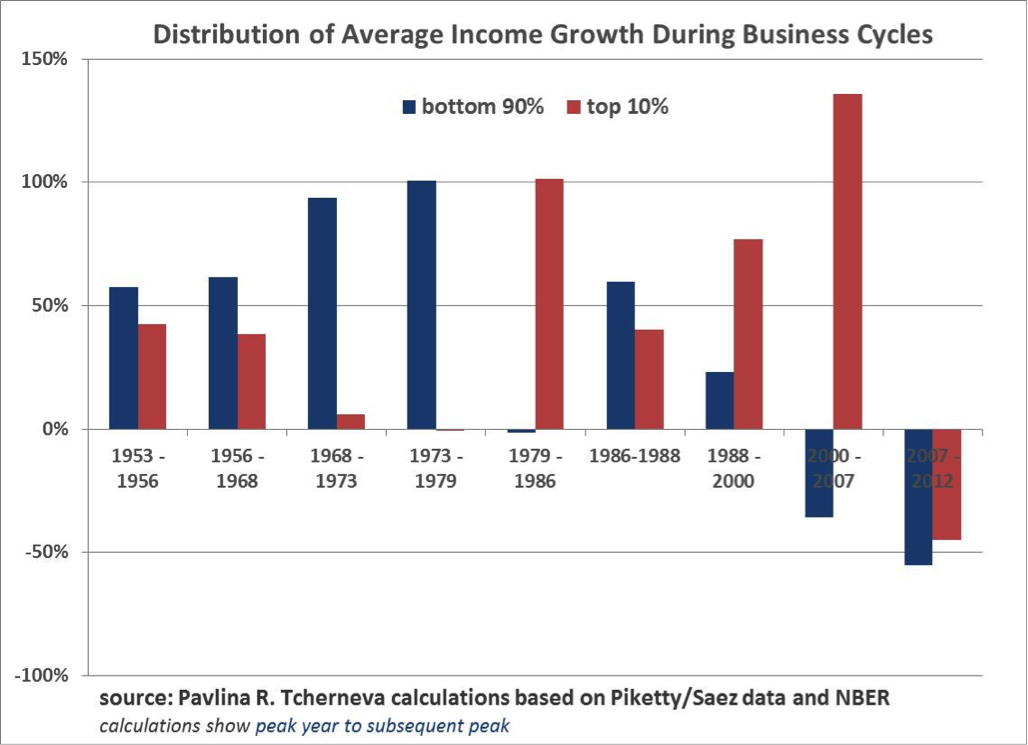
There is a clear shift in trend after the 80s. During 3 out of the last 4 complete business cycles, the wealthy 10% have gotten a proportionately greater share of the growth. And in the last full business cycle (2000-2007), they got all of the growth, while incomes of the bottom 90% fell. Yes, since 2007, both groups shared the losses about equally, but why should we be surprised that the top 10% shouldered 45% of the decline? (Again, this is not a complete business cycle yet!)
We live in a casino economy driven by serial asset bubbles, where the incomes of the wealthy (and not just their capital gains) are increasingly tied to stock market performance.
So when the biggest bubble in human history popped, the wealthy families lost a ton of income. At the same time middle class households fell into poverty, lost their decent jobs and pay, and got unemployment insurance or food stamps from the government. Can one really conclude from this that inequality is not “that bad”?
As an example, inequality will not be “that bad” if one person in the US earned 100% of all the national income, and then the ‘evil government’ (or ‘benevolent dictator’; take your pick) decided to tax most it and then gave transfers to the rest. But is this the kind of ‘better’ income distribution that we are aiming for? Aren’t we all talking about an economy where most people have decent jobs, decent wages, decent salary growth prospects, and decent chance to participate and share in that growth?
There are many ways to slice and dice this data.
I have looked at expansions because they answer a very specific question: Once the economy returns to some normalcy and promises to deliver prosperity, to whom does it keep its promise? And the answer is, increasingly to the top 10%.
The problem with the NYT article is not the inequality chart, even though it shows an incomplete and thus misleading business cycle picture. The problem is the conclusion: that ‘taxes’ and ‘transfers’ are the solution to the deep structural economic problems that are causing the generation and distribution of incomes to be so inequitable from the very outset.
So the next time someone tells you that “a rising tide lifts all boats”, you can respond “no, increasingly it sinks most”.
*updated (2/20/2015 14:00 CT)


5 responses to “What’s Wrong with David Leonhardt’s NYT Piece on Inequality?”