
The New York Times and Dave Leonhardt’s Upshot section made a big splash a few days ago by reporting on a study showing that the Canadian middle class had caught the US middle class in median income and likely surpassed it since. The study is based on an effort to measure median income per capita after taxes, and its results are presented as something truly significant.
However, I think the study is biased in that in median income per capita after taxes, it selected the wrong measure. What is needed is a measure of income or affluence that takes account of the value of cross-national variations in Government benefits delivered to the middle classes. Since the United States has lower taxes than most comparable nations, but delivers much less in safety net and entitlement benefits, it’s pretty clear that the measure used in the study reported on by The Times overestimates the real median income of the US middle class in comparison with the middle classes of other comparable nations and provides a misleading impression of the relative affluence of the American middle class.
In fact, it is likely that if real median income or median wealth per capita were measured in a more valid way that the study would have found that the US has lost its lead over other nations in Net Median Income Per Capita (median income per capita after taxes minus the cost per capita of benefits the State does NOT provide relative to the nation with the most generous safety net benefits), or per adult long before 2010. This is suggested by an earlier post of mine which I’ll now reproduce in full and then briefly discuss to conclude this one.
We’re No. 24! We’re No. 24! (As of July 2012)
We keep hearing bad news about where the US stands on various social and economic indicators. The US’s ranking in math capability is 27th in the world. Our health care system is ranked 37th. Our 2011 life expectancy is 51st in the world. Our estimated 2012 infant mortality rate is 49th in the world. So we’re pretty far down in a number of international statistical comparisons of performance. Some here point to better performance on economic indicators. For example, GDP per capita is often cited as an area where the US performs much better. But even here the latest CIA world handbook estimate shows the US ranked 19th on this measure at $48,400.
It gets even worse if you take a look at the recent Credit Suisse Global Wealth Databook 2011. Dylan Matthews, writing on Ezra Klein’s Wonkblog, did that on July 18th in a blog entitled “Are Canadians Richer Than Americans?” Matthews says yes, based on the Credit Suisse data on 2011 Median Wealth per Adult, and he goes on to also point out that:
”So not only does Canada beat the United States on median net worth. Just about every developed country save Sweden and Denmark does. The UK, Japan, Italy (!) and Australia more than double the U.S. Median.”
This important conclusion of Matthews gets a bit lost in the post’s central focus on a US/Canada comparison and his attempt to answer his lede question. A few days later, wigwam posted at MyFDL blogging on the Matthews piece, and presenting a table wigwam developed from the graphic used in the Matthews piece.
Wigwam’s numbers are approximate because he developed his table, from Matthews’s graphic, but his emphasis on the context of where the US stands relative to other nations is much greater than in Matthews’s post, and he also ties it into other issues such as foreign aid to Israel, the 99% vs. the 1%, and rising poverty in the United States. Wigwam’s money lines are:
“This is a chart that I’m going to show when Mitt Romney fans talk about “what makes American exceptional.” It vividly documents how badly America’s 99% are being screwed by its 1%. We’re a wealthy nation only when you count the trillions controlled by the 1% but not so wealthy when you look at the net worth of the median household.”
So, that’s what got me looking at the Credit Suisse Report. When I did, I found that Matthews had truncated the Credit Suisse data, and that in doing so he had missed some important aspects of US economic performance compared to other nations when viewed from the perspective of a “middle” US economic position. Wigwam, as well, in basing his post on Matthews’s, also reflects the same problems.
Specifically, Matthews and wigwam both included only 19 nations in their analyses, and ranked the US 17th out of 19th. In addition, in approximating the numbers in his table he departed a good bit from the actual median wealth per adult numbers in a number of cases. Here’s a chart that includes the first 36 ranks in the Credit Suisse data.
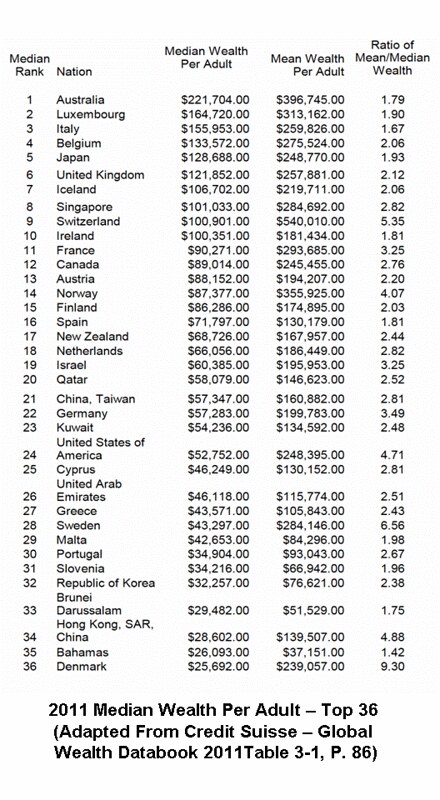
Looking at the results, you can see that the United States isn’t 17th on Median Wealth per Adult, it’s 24th. Now Luxembourg, Belgium, Iceland, Singapore, Austria, Qatar, and Kuwait, are all also ahead of the US in median Wealth. The “median person” is more than three times as wealthy in Luxembourg, more than two-and-a-half times as wealthy in Belgium, and more than twice as wealthy in Iceland and Singapore than in the US. Among nations that were included in the original WaPo and MyFDL comparisons, the “median Australian” is nearly 4.5 times as wealthy as the “median American; the “median Italian” is three times as wealthy. Japan and the UK have medians in the neighborhood of 2.5 times the US median, while Switzerland and Ireland have medians in the range of double the US number.
In short, the comparison with 36 nations included, shows that the US stands even worse, relatively speaking, than in the 19 nation comparison. The numbers show that many nations with recent and current severe banking/financial problems still have median wealth numbers that greatly exceed ours.
These include: Italy, Belgium, Iceland, Ireland, and Spain. The first four show more than double the median wealth of US adults and the last has a 40% greater median wealth figure. The US Fed is being called upon to use US nominal financial resources “created out of thin air” to bail out the financial systems of these nations, and will probably continue to provide such backing to “save the financial system.” The irony of our doing that when we refuse to use vigorous fiscal policy to help our own middle and working class people to remain employed, get new jobs, and work for a living wage, is another of those outrages to our democracy we experience every day.
The mean-to-median ratio numbers are also interesting to say the least. Nations with a ratio under 2.00 include Australia, Luxembourg, Italy, Japan, Ireland, Spain, Malta, Slovenia, Brunei, and the Bahamas. A majority of nations have ratios between 2.00 and 3.00. Nations over 3.00 include: Switzerland (5.35), France (3.25), Norway (4.07), Israel (3.25), Germany (3.49), the US (4.71), Sweden (6.56), China (4.88), and Denmark (9.30). So, the US is among the most unequal nations in the world on this measure. Among the nations that exceed it in inequality, the numbers for Sweden and Denmark may be statistical artifacts. The World Bank Gini number for Denmark is 24.9 and for Sweden is right behind at 25 with Norway coming in at 26, while the Gini is 41 for both the US and China, and 34 for Switzerland. This suggests that there may be something about the way welfare state transfer payments are accounted for that doesn’t get into the Credit Suisse Median Wealth per Adult statistics. Wigwam suggests:
“One of the anomalies in this data is that personal retirement plans (e.g., IRAs) usually count toward “net worth,” while general retirement plans (e.g., a public employee’s defined-benefit plan and/or Social Security) don’t. I’m told that Sweden and Denmark have excellent plans that take care of the elderly. Not only don’t those plans count toward their citizens’ “net worth,” but the excellent quality of those plans encourage their citizens not to save. If you had super-excellent government coverage to care for you in your elder years, would you set aside as much as the typical American? My point is that the median American is really at the bottom of this graph.”
Finally, I think the Credit Suisse Report gives the best picture yet of the failure of the US political/economic system to progress as rapidly as the systems in other modern nations. The jingoistic beating of our chests, insisting that the US is “the richest nation in the world”, with an unequaled political/economic system, just doesn’t square with reality. It may make a great many Americans feel good. But it’s not true and it doesn’t help us to face and adapt to our circumstances. In the end “all life is problem solving;” and you can’t keep on living well if you won’t recognize and then solve your problems.
Our system hasn’t produced the advantages for most Americans that other systems have produced for the citizens of their nations. How long will we continue to deny this in the face of mountains of cross-national data, and instead insist that our way is best? It may be best for 1% of us, but for the overwhelming majority, it is close to the worst among advanced modern industrial nations. Other nations produce better health for their citizens, healthier children and seniors, better education for their citizens, better work lives, less stress, more happiness, low cost universities. You name it; they’ve got it!
What we’ve got, instead, is an ideology about the free market that works for very few of us and makes the rest us less free, less wealthy, less secure, and less happy, as time goes on. Our economic system isn’t delivering for us. Our political system isn’t delivering for us either, it’s corrupt through and through, and our leaders won’t prosecute the rampant control fraud in the financial sector. And, finally, all we get from our representatives is excuses and rationalizations about why we can’t adapt to the changes, we, ourselves, had a great part in bringing to the world.
So, what can we do about it? I’m afraid this post isn’t about that. But, I think what we have to do is to create a new web-based Information Technology platform we can use to create a meta-layer of political activity that will take control of the major parties and either make our representatives accountable to the 99%, or replace them with new people who will be responsive to them. I’ve written about this a number of times previously. See here, here, and here, for example; and yes, it can’t be done in time for the 2012 election. Sorry about that, but what we have to do can’t be done in three months, and we should have started doing it three years ago if we wanted to be ready now.
That ends the previous post. Here’s the conclusion.
The Significance of Variations in Median Wealth Per Adult for Net Median Income Per Capita
Median Wealth Per Adult isn’t a direct measure of Net Median Income Per Capita. In fact, if we had a better measure of Net Median Income Per Capita, than Median Income Per Capita after taxes, we’d probably want to use it to test to see whether stagnant Net Median Incomes Per Capita after taxes lead to rapid declines in Median Wealth Per Capita. That is, to see whether trends in the flow of income impact stocks of wealth.
Lacking such a measure, however, and assuming that where the US stands on the stock of Median Affluence is more important in the first instance than where it stands on the flow of Median Income, it’s hard to avoid the conclusion that Median Wealth Per Adult is a better indicator of relative affluence of the middle class than Median Income Per Capita after taxes. Since that’s the case, it’s hard to justify all the attention this study is getting from the MSM and a good part of the blogosphere.
It’s now old news that the United States has been surpassed by other nations in Median Wealth Per Adult, and as my post shows, its Median Wealth Per Capita was less than 25% of Australia’s while the distribution of wealth in the US is far more unequal than the distribution in that and many other (including other English-speaking) nations as measured by the ratio of the Mean Wealth Per Adult to Median Wealth Per Adults.
So, one question which immediately comes to mind is if that’s old news, then would we not expect that such a result could only have happened if the United States had long since lost its lead in what I’ve been calling Net Median Income after Taxes, since that kind of result in Median Wealth Per Capita could have come about only primarily through an accumulation of Higher Net Median Incomes Per Capita over a period of years? If so, then the real news from the Times Report is that Median Income Per Capita is just a poor measure of affluence and has propped up the notion that the US middle class is especially affluent long past the time when this ceased to be the case.
In other words, the Times Report says more about the shortcomings of The Times when it comes to economic analysis, than it says about the real changing position of the US Middle Class when it comes to affluence. Oh, and to underline the point, the above table suggests that Canada hasn’t just passed the US relative affluence of its middle class, but that this happened some time ago, since in 2011 Canada’s Median Wealth Per Adult exceeded the US’s by nearly $36,000 per adult, or by roughly 69%, a change in relative affluence that had to be developing over a relatively long period of time, long before The Times decided to proclaim this as “news.”


Pingback: Did Canada’s Middle Class Just Get More Affluent Than the US’s, or Did that Happen Long Ago? | naked capitalism
Pingback: Did Canada’s Middle Class Just Get More Affluent Than the US’s, or Did that Happen Long Ago? | New Economic PerspectivesNew Economic Perspectives « The Progressive Mind