
L. Randall Wray
In recent days the international policy-making elite has tried to distance itself from MMT, often going to hysterical extremes to dismiss the approach as crazy. No one does this better than the Japanese.
As MMT began to gather momentum, its developers began to receive a flood of calls from reporters around the world enquiring whether Japan serves as the premier example of a country that follows MMT policy recommendations.
My answer is always the same: No. Japan is the perfect case to demonstrate that all of mainstream theory and policy is wrong. And that it is the best example of a country that always chooses the anti-MMT policy response to every ill that ails the country.
Reporters find that shocking. Biggest government fiscal deficits in the developed country world? Check. Highest government debt ratios in the developed country world? Check.
Isn’t that what MMT advises? No.
Nay, it is the perfect demonstration that all the mainstream bogeymen are false: big deficits cause inflation? No. Japan’s inflation runs just above zero. (See graph https://asia.nikkei.com/Economy/Growing-Modern-Monetary-Theory-debate-rattles-Japan-officials.)
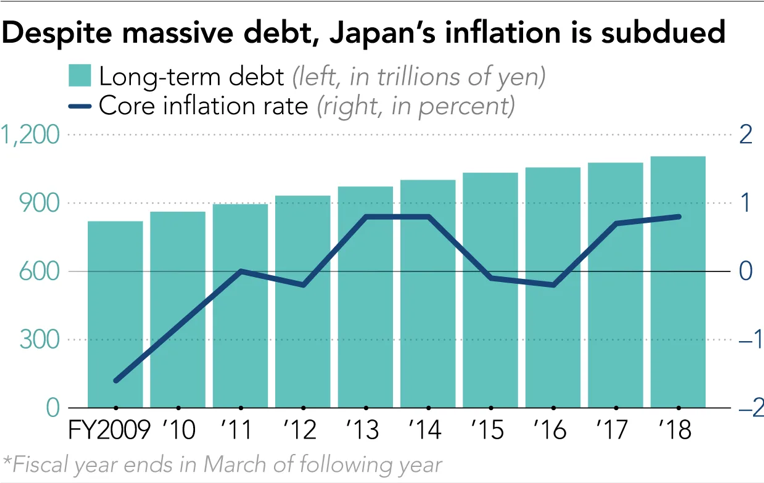
Big debts cause high interest rates? No. Japan’s policy rate is about -0.10 (negative rates).
Big debts cause bond vigilante strikes? No. Japan’s government debt is hoovered up as fast as it can be issued. (All the more true with the BOJ running QE and creating a “scarcity” in spite of the quadrillions of yen debt available.)
Critics of MMT counter that Japan is “proof” that big deficits kill investment and growth.
Well, it is true that Japan has been growing at just 1% per year—certainly nothing to write home about. However, investment grows at about a 2% pace, but is pulled down by lack of consumption growth—which has averaged just about zero over the past few years.
Yet, unemployment clocks in at only 3%–in spite of slow growth—as the labor force shrinks due to an aging population. Per capita GDP has been stuck at about $38,000 for years (not so bad, but not growing). And Japan’s current account surplus has surged from under 1% to 4% of GDP over the past few years (considered to be good by most commentators).
Unfortunately Trump’s trade war seems to have already hurt Japan’s exports and the prognosis for growth this year is rather dismal. The April survey of consumer confidence showed it collapsing to the lowest level in three years. (https://www.focus-economics.com/countries/japan)
From the MMT perspective, what Japan needs is a good fiscal stimulus, albeit one that is targeted.[i] Japan has three “injections” into the economy: the fiscal deficit (which has fallen from 7% of GDP to about 5% over the past few years—still a substantial injection), the current account surplus, and private investment. But what it needs is stronger growth of domestic consumer demand—which would also stimulate investment directed to home consumption. So fiscal policy ought to be targeted to spending that would increase economic security of Japanese households to the point that they’d increase consumer spending.
So what is Prime Minister Abe’s announced plan? To raise the sales tax to squelch consumption and reduce economic growth.
You cannot make this up.
This has been Japan’s policy for a whole generation. Any time it looks like the economy might break out of its long-term stagnation, policy makers impose austerity in an attempt to reduce the fiscal deficit—and thereby throw the economy back into its permanent recession.
Clearly, this is the precise opposite to the MMT recommendation. And yet pundits proclaim Japan has been following MMT policy all these years.
Why? Because Japan has run big fiscal deficits. As if MMT’s policy goal is big government deficits and debt ratios.
No. We see the budget as a tool to pursue the public interest—things like full employment, inclusive and sustainable growth. To be sure, by many reasonable measures Japan does OK in spite of policy mistakes. Certainly in comparison to the USA, Japan looks pretty good: good and accessible healthcare, low infant mortality, long lifespans, low measured unemployment, and much less inequality and poverty. But Japan could do better if it actually did adopt the MMT view that the budgetary outcome by itself is not an important issue.
But, no, the Japanese officials are falling all over themselves to make it clear that they will never adopt MMT. Finance Minister Taro Aso called MMT “an extreme idea and dangerous as it would weaken fiscal discipline”.
One wonders how a reporter could listen to that without bursting out in laughter. Japan’s “fiscal discipline” would be threatened by MMT? The debt ratio is already approaching 250%! By conventional measures, Japan has the worst fiscal discipline the world has ever seen!
But, wait, it gets even funnier. “BOJ policy board member Yutaka Harada kept up the attack on MMT. The approach proposed by MMT will ‘cause [runaway] inflation for sure’. “ https://asia.nikkei.com/Economy/Growing-Modern-Monetary-Theory-debate-rattles-Japan-officials
The BOJ has done everything it could think of for the past quarter century to get the inflation rate up to 2%. Quadrillions of QE. Negative interest rates. And the BOJ thinks MMT could produce runaway inflation? I doubt that even Weimar’s Reichsbank could cause high inflation in Japan.
OK, that’s a cheap shot at Japan’s policymakers.
What they do not understand is that there are two ways to produce a high deficit (and debt) ratio: the ugly way and the good way. MMT has been arguing this for a long time, but with little progress in promoting understanding. I think that the main reason is because we’ve been using plain English. Economists are not good at reading for comprehension. They need pictures and math. Perhaps the following will help.
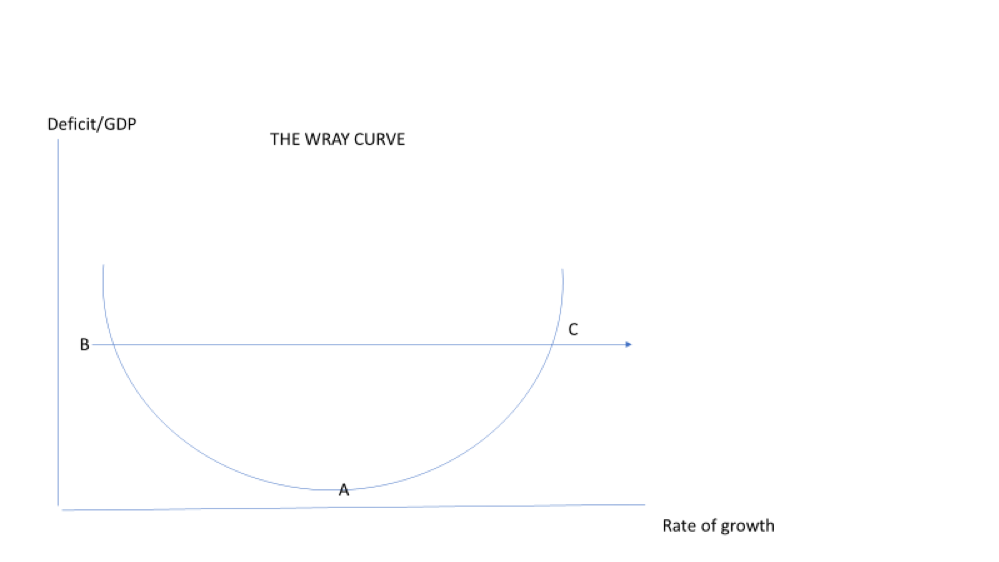
Yes, I gave it a name. There’s the Laffer Curve, the Phillips Curve, and now the Wray Curve. I didn’t draw it on a cocktail napkin at a bar, but, rather, jotted it down on a note pad before bed last night.
Assume the economy is at Point A—for Japan this would represent a 5% deficit ratio and a 1% rate of growth. Now PM Abe imposes a consumption tax, or the USA plummets into a downturn, reducing Japan’s growth rate. The economy moves up and to the left toward Point B as growth slows and the deficit ratio rises.
Slower growth reduces tax revenue even as it scares households and firms, which reduce spending in an effort to build up savings. The slower growth also reduces imports so the current account “improves” somewhat. From the sectoral balance perspective, the government’s balance moves further into deficit (to, say, a 7% fiscal deficit), the current account surplus rises (say from 4 to 5%) and the private sector’s surplus grows to 12% (the sum of the other two balances).
That’s the ugly way to increase a fiscal deficit. It is the Japanese way. It is like a perpetual bleeding of the patient in the hope that further blood loss will cure her ills.
What is the MMT alternative? Measured and targeted stimulus designed to restore confidence of firms and households. Ramp up the Social Security safety net to assure the Japanese people that they will be taken care of in their old age. Recreate a commitment to secure jobs and decent pay. Either promote births or encourage immigration to replace the declining workforce. Undertake a Green New Deal to transition to a carbon-free future.
In that case we move along the curve from Point A toward Point C. The fiscal deficit increases in the “good” way, while growth improves.
Note, however, that the boost to the deficit will only be temporary. Households and firms will begin to spend and their surplus will fall. The current account surplus will fall, too, as imports rise. Tax revenues will increase—not because rates rise but because income increases. The fiscal deficit will fall as the domestic private surpluses decline. Precisely how much the deficit will fall depends on the movement of the private surplus and current account surplus—with the deficit falling to equality with the sum.
In terms of the graph above, the Wray Curve shifts out to the right. Point A will be consistent with a higher rate of growth for a given deficit ratio. There’s nothing “natural” about the deficit ratio at Point A—as it depends on the other two sectoral balances.
For the USA, Point A is consistent with a higher growth rate but probably a similar deficit ratio to that of Japan. Our current account balance is of course negative—which implies a higher fiscal deficit. However, our private sector’s surplus is smaller than Japan’s for any given growth rate—which implies a lower fiscal deficit. The two essentially offset one another to leave the US deficit ratio at about 5% but with higher growth than Japan.
Note that we are not proposing a sort of Reverse Laffer Curve. Recall that the Laffer Curve says that tax cuts more than “pay for themselves”—trickle-down growth boosts revenue sufficiently to close a fiscal deficit. I am not arguing that the stimulative increase of government spending will increase tax revenue so much that the deficit ratio returns to its original level (or less). Where it actually ends up depends on movements of the two other sectoral balances.
Not that the size of the deficit—by itself—is important. What is important is whether government budget policy helps in the pursuit of the public and private interests. The deficit will always adjust to be “just the right size” to balance the other two sectoral balances. But that equality can be consistent with any growth rate—including a rate that is too low (deflationary) or too high (inflationary).
And the sectoral balance equality holds with any fiscal deficit ratio. So while it is likely that a successful stimulus will shift the Wray Curve out to the right, we cannot predict exactly where the new fiscal deficit ratio will settle as the growth rate rises.
What is most important about this graph is the recognition that there are (at least) two different growth rates consistent with a given deficit ratio. We can achieve a particular growth rate either in the “ugly” way or in the “good” way—while generating the same deficit ratio. Japan continually operates its economy to produce “ugly” deficits—precisely because it fears fiscal expansion.
For further discussion of fiscal deficits along these lines, see the new textbook by Mitchell, Wray and Watts, Macroeconomics (Macmillan International, Red Globe Press), Chapter 8, and especially pp. 124-128.
[1] Note: I am presuming that Japan is unhappy with zero growth, and that the country faces many unmet domestic needs. I am not an advocate of “growth for growth’s sake”—especially in light of the growing recognition that humanity may well have only a decade or so left on planet earth unless we very quickly change our ways. However, “changing our ways” will require major investments in a Japanese Green New Deal—so even with zero growth, there is a role for ramped up fiscal policy.


14 responses to “JAPAN DOES MMT?”