
By Eric Tymoigne
For convenience, I have put the balance sheet of the Fed below. Post 2 examined the balance sheet and Post 3 provided important information about the meaning of reserves and other basic concepts and their relation to the balance sheet of the Fed. Now let us look at monetary-policy implementation.

What does the Fed do in terms of monetary policy and why?
While details in operating procedures have changed through time, the federal funds rate (FFR) has progressively gained in importance as a relevant operating tool (i.e. means to implement monetary policy) since the 1920s. The FFR is the rate at which participants in the federal funds market lend and borrow federal funds (“fed funds” for short) to each other overnight.
Fed funds are the dollar value of the Fed accounts (L2, L3, and L4). Holders of these accounts include private banks, the U.S. Treasury, government-sponsored enterprises, the International Monetary Fund, securities firms, among others. Some of these account holders need more funds (usually banks) while others usually have more than needed. The fed funds market allows these participants to meet and make deals.
The Fed is highly interested in the FFR and aims at targeting that rate, i.e. the Fed wants to make sure that the FFR (that is market determined) does not deviate too much from the FFR desired by the Fed (the FFR target) (Figure 1). Most of the time the Fed targets a specific number but sometimes it targets a range. This is the case today with a range of 0.25-0.5%. From the late 1970s until 1991, the Fed also had a range that was as high as 16%-22% in mid-1981 and as wide as 13%-20% in early 1980 (Figure 2). Since 1994, the FFR target has been public information as the Fed committed to become more transparent.
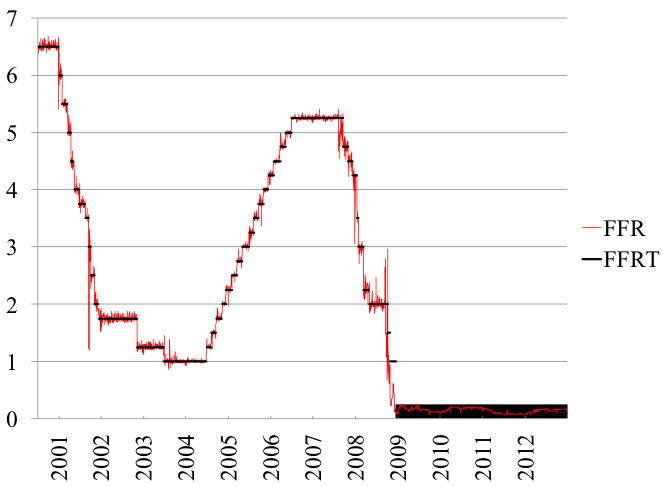
Figure 1a. Daily average of FFR and Target FFR, Percent
Source: Federal Reserve Bank of New York.
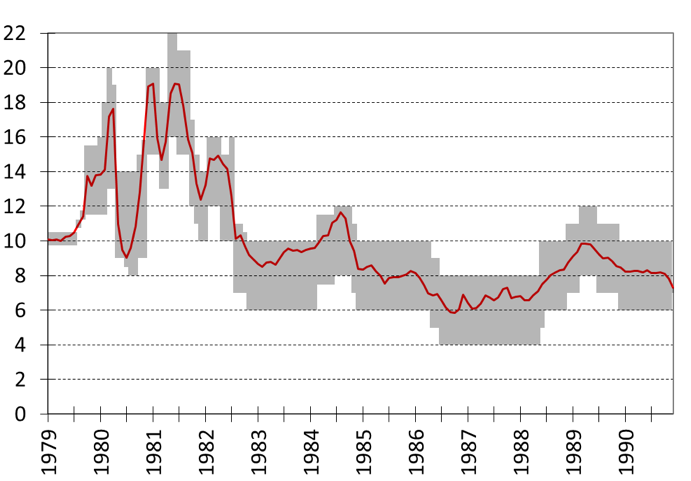
Figure 1b. Monthly FFR Average and Target FFR range, 1979-1990, Percent
Source: Transcripts of the FOMC meetings
Note: After 1990, the FOMC targeted a FFR digit
The Fed is highly interested in this interest rate for two main reasons. First, the FFR is a cost for banks so if the cost changes, the interest rates they charge to customers change. Second, market participants make portfolio choices (i.e. buy assets) with the aim of maximizing rate of return. They compare portfolio strategies and choose those that provide the highest return. While making these portfolio choices, financial-market participants take into account future monetary policy (i.e. future FFR target), which ends up impacting the current interest rate of a wide range of securities.
Regarding the cost side of FFR, banks need reserves for four purposes:
- Withdrawals by customers: people get cash from ATMs
- Reserve requirements: banks must keep a certain amount of reserves that is a proportion of the bank accounts they issued
- Interbank settlements: paying debts due to other banks
- Payments to other Fed account holders: for example tax payments leads to a drainage of reserves
By far, the largest day-to-day need is interbank settlements because banks that do not have enough reserves to meet payments must get reserves to avoid default. They may get them either from other banks or other fed funds holders, or may go to the Fed. In any case, banks have to pay an interest and the FFR is what banks pay to get reserves through the fed funds market (“non-borrowed reserves”). This cost is then passed to their customers so, when the FFR rises, rates on mortgages, advances to students, credit cards, etc. also go up (see prime bank rate in Figure 3).
In terms of portfolio choices, say that in 2016 you have $1000 and you want to figure out a way to make the highest gains over the next two years. Say only two portfolio strategies are available. A “long-term strategy” is to buy and hold for two years a 2-year security that pays 5%. A “short-term strategy” is to buy a 1-year security that pays 3% and to reinvest the proceeds in 2017 into another 1-year security. Your choice between the two strategies should depend on what you expect the 1-year rate to be in 2017. You are indifferent between the two strategies if they provide the same rate of return, which means that you expect a 1-year of about 7% in 2017 (solve $1000*(1.05)2 = $1000*1.03*(1+x) where x is the expected one-year rate in 2017). If you expect the 1-year rate to be higher than 7%, the short-term strategy is more profitable. In that case, financial-market participants will sell outstanding 2-year securities and buy 1-year securities, which raises the 2-year rate and lowers the 1-year rate until the two strategies provide the same rate of return. Generalizing the logic, a rising FFR (similar to 1-year rate going up) raises the rates on longer-term securities. Long-term rates depend on expectations about future monetary policy and if FFR is expected to rise (fall), long-term rates will rise (fall).
There is a very high correlation between the FFR and all other interest rates. The correlation is about 0.99 for short-term securities and about 0.8 for long-term securities like T-bonds (Figure 3). Beyond expectations about future FFR, the interest rate on securities, especially of longer terms to maturity, is also influenced by inflation risk, tax risk, credit risk, liquidity risk, among others, which makes the link between FFR and longer-term securities less strong.
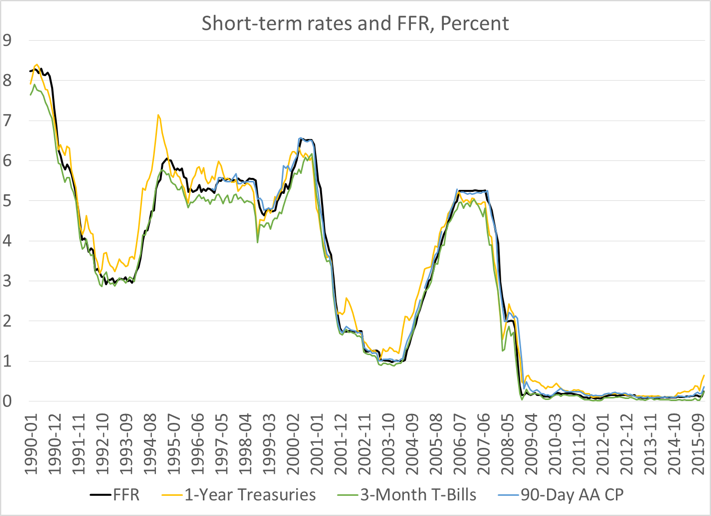
Figure 3a. FFR and other rates
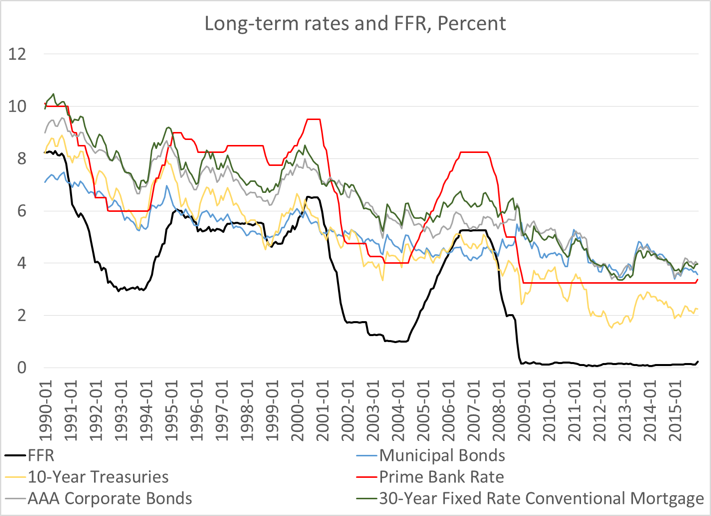
Figure 3. FFR and other rates
By influencing interest rates, the Fed hopes to influence the willingness of the private sector to spend on goods and services; the ultimate goal being to influence inflation and employment. For example, if the Fed thinks that inflationary pressures are building up, the reasoning goes at follows: Higher expected inflation by the Fed leads to a higher FFR target, which raises the FFR, which raises other rates, which discourages private economic units to seek external funds and raises thriftiness, which slows down spending on goods and services, which lowers inflation. There are a lot of steps between FFR and inflation/employment, and one may doubt it works well, but that is the logic behind the intervention of the Fed in the fed funds market.
The Fed has a dual mandate, i.e. its goal is to achieve both price stability (currently defined unofficially as achieving a 2% inflation rate) and full employment (defined as being at an unemployment rate at which inflation is stable, the “NAIRU”). Other central banks, like the European Central Bank, only focus on price stability.
Targeting the FFR prior to the 2008 financial crisis
While banks do need reserves, they also do not like to hold more reserves than they need because reserves do not pay any interest. Post 3 shows that, prior to the crisis, banks held very little reserves, and most of them were held because the Fed required it. Banks like to keep a bit of excess reserves to avoid the overnight-overdraft penalty rate (remember that L2 can be negative).
What happens if banks cannot get enough fed funds? Banks cannot create more than what is available, only the Fed can. If the Fed does not add more fed funds then the FFR will rise steeply and quickly given that bank must have the reserves they need (a higher FFR does not incentivize banks to demand less fed funds).
What happens if banks have too many fed funds? Banks cannot destroy/remove fed funds, only the Fed can. If the Fed does not remove fed funds, the FFR will fall very quickly to 0% given that banks do not have anything else to do with the excess reserve balances they have (a lower FFR does not give incentive to supply less fed funds).
To minimize fluctuations in the FFR and keep it around the target, the Fed intervenes to add or remove fed funds by adding or removing reserve balances according to the needs of banks. If the FFR is above target then the Fed adds reserves, if the FFR is below target the Fed removes reserve balances.
The way the Fed does this is via open-market operations that usually involve trading T-bills with banks (Figure 4):
- If FFR < FFRT, banks lend and borrow at a too low interest rate relative to what the Fed wants. To correct that the Fed sells T-Bills to banks, which drains reserves.


- If FFR > FFRT, banks lend and borrow at a too high interest rate relative to what the Fed wants. Banks have too few reserves. To correct that the Fed buys T-bills from banks by crediting their reserve balances.


The open-market operations can be permanent (“outright purchase/sale” by the Fed) or temporary (“repurchase agreement” and “reserve repurchase agreement”: the Fed and banks agree to perform the opposite transaction the following morning). Of course for banks to agree to trade with the Fed instead of putting reserves in the market—or for banks to get reserves from the Fed instead of borrowing from other banks—the Fed has to provide incentives. The Fed also has to make trades that ensure that the FFR stays around its target.
Suppose that a bank has $1000 worth of reserves that it is ready to supply in the fed funds market. Suppose that the FFR is currently at 3%, where the Fed wants it to be, but if the bank supplies the funds the FFR will fall to 2%. How can the Fed entice the bank not to dump the funds in the market? Suppose that the Fed holds T-bills that will mature in one year. The Fed may sell to the bank one of these T-bills for $997. If the bank holds it to maturity, it will earn a 3% annual rate of return (U.S. Treasury will repay $1000 in one year).
The Fed does something similar when banks borrow fed funds at a rate higher than what the Fed wants (FFR > FFRT). It buys T-bills at a price consistent with FFRT. That forces those willing to lend fed funds to comply with the FFRT, otherwise no bank will borrow from them given that the Fed offers to provide reserves at a lower rate.
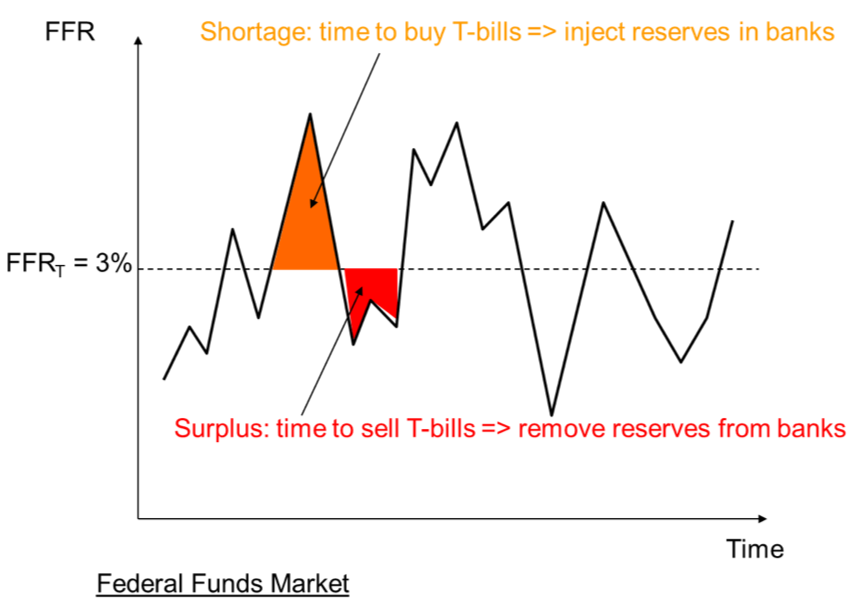
Figure 4. The Federal Funds Market
The Fed could do this all day long and FFR would be on target all the time, but practically the Fed only intervenes once a day and accepts that the FFR fluctuates around the target. Each day, the Fed anticipates the approximate need for reserves by estimating how the items that change the monetary base will change during the day (A1 through A5, L3, L4, and L5).
The Fed is basically applying a sort of buffer-stock policy on reserves in the same way diamond cartels limit the supply of diamond to control diamond price (I am sorry to tell you that diamonds are not rare). The main difference between the Fed and diamond cartels is that the Fed has complete pricing power because it is the monopoly supplier of reserves.
Beyond day-to-day intervention in the fed funds market to maintain a FFRT, the Fed also sometimes changes its FFRT. Given that the demand for reserves is almost perfectly inelastic and given how small the increments and decrements in FFR target are (usually 0.25% at a time), when the Fed changes its FFR target, it usually does not do anything for the target to be reached. If the Fed decides to lower the FFR target, it does not have to inject reserves first for the target to be reached. If the Fed decides to raise the FFR target, it does not have lower the quantity of reserves to reach the target. The FFR will move quickly around the target following the announcement of a change. This absence of a liquidity effect has been well documented.
Another way to understand that is to again go back to the point that banks cannot do much with reserve balances, so any reserves they have in excess they will supply in the market. If the Fed announces it will offer reserves at a lower FFRT, banks with reserves to lend must comply with the new FFRT when they offer to lend reserves otherwise nobody will borrow from them. If the Fed announces it will offer reserves at a higher FFRT, banks with reserves to lend raise the rate at which they will lend too. Otherwise they lose an income opportunity because banks that need reserves have nowhere else to go (only the Fed can create more reserves and it will do it only at a higher FFR). It the Fed’s way or the highway.
A graphical representation of the Fed fund Market
The Fed supplies, at a cost equal to the FFR target, whatever amount of reserves is needed (Figure 5). The demand for reserves is almost perfectly insensitive to changes in FFR (let us ignore complications that comes from reserves requirements, which would flatten the demand for reserves at the FFRT). Banks must meet interbank payments, tax payments, reserve requirements and withdrawals regardless of what the FFR is, and banks have very little incentive to ask for more reserves when rates fall because banks cannot do much with them.
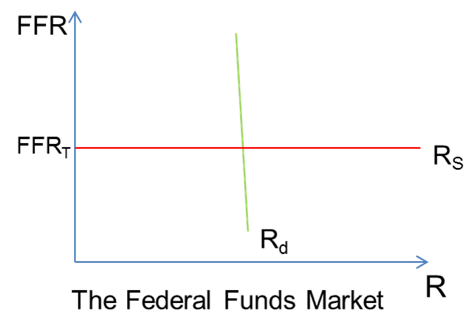
Figure 5
The fact that the supply of reserves is horizontal seems to suggest that the Fed supplies an infinite amount of reserves. That is not the case, all that is saying is that the Fed supplies whatever banks demand. If banks want more reserves (demand curve shifts to the right), the Fed supplies more. If banks want less reserves, the Fed removes reserves; the currency is “elastic.” The Fed does not proactively add or remove reserves:
- If the Fed adds reserves without consulting banks, the FFR falls to zero.
- If the Fed removes reserves without consulting banks, the FFR rises to infinity.
Thus, while the Fed does the injection and removal of reserves, the Fed adds or removes only on a defensive basis to maintain the FFR on target.
What monetary policy is all about is setting the price of reserves. The FFR is a policy variable that does not reflect any scarcity or abundance of reserves, or the preference of banks for reserves:
- A low FFR can prevail with very little reserves: if banks do not need many reserves, the Fed does not supply many at a given FFR target
- A high FFR can prevail with a very large amount of reserves: if banks need lots, the Fed supplies lots at a given FFR target.
Targeting FFR after the Great Recession
As the financial crisis grew from 2007, the Fed began to lower its interest rate from late 2007 (Figure 1) and, from early 2008, to provide significant emergency funds to the financial system (Figure 6). At first, the Fed neutralized the impact of all emergency advances by selling treasuries so its supply of treasuries fell by 40% in about six months (Figure 6). The Fed provided reserves to bank X that was in difficulty, bank X paid its creditor bank Y, bank Y had excess reserves available to lend in the fed funds market, Fed drained all excess reserves by selling treasuries to bank Y. This allowed the Fed to maintain a positive FFR while also helping struggling financial institutions.
In September 2008, the collapse of Lehman Brothers led to a panic and the Fed responded by providing large amounts of emergency advances (A2 went up a lot). No fed funds market participant was willing to lend reserves to anybody; the fed funds market froze and the FFR became highly volatile (Figure 1). Emergency advances by the Discount Window led to a very large increase in reserve balances by almost $1 trillion by early 2009. From September 2008 until the end of the year, in order to keep FFR positive, the Fed did try to neutralize some of the impact of its massive emergency operations by working with the Treasury (Post 6 delves into the Treasury-central bank coordination). However, in order to fight the recession (and so potential deflation and unemployment), the Fed also rapidly lowered its FFR target that reached zero (0-0.25% range to be precise) by December 2008 (Figure 1).
The Fed then wondered what it could do next to help lower interest rates further given that the FFR target was at 0% and given that the Fed did not intend to have a negative FFR target. Two things were done:
- Promise not to raise the FFR target for a long time (“forward guidance”): this pushed expectations of a rise in FFR further in the future and so lowered interest rates.
- Outright purchases from banks of long-term securities with the goal of lowering long-term interest rates (“credit easing” followed by “quantitative easing”). By buying long-term securities, the Fed raised the price of these securities which lowered their yield.
The Fed bought outright long-term treasuries but also long-term private securities (Mortgage-backed securities guaranteed by Fannie Mae, Freddie Mac and Ginnie Mae) (Figure 6, Table 1). It did so without neutralizing the impact on reserves so reserves balances increased rapidly beyond the needs of banks. As a consequence, if the Fed had continued to operate as it did before the crisis, the FFR would have stayed stuck at 0% for as long as there would have been a large amount of excess reserves.
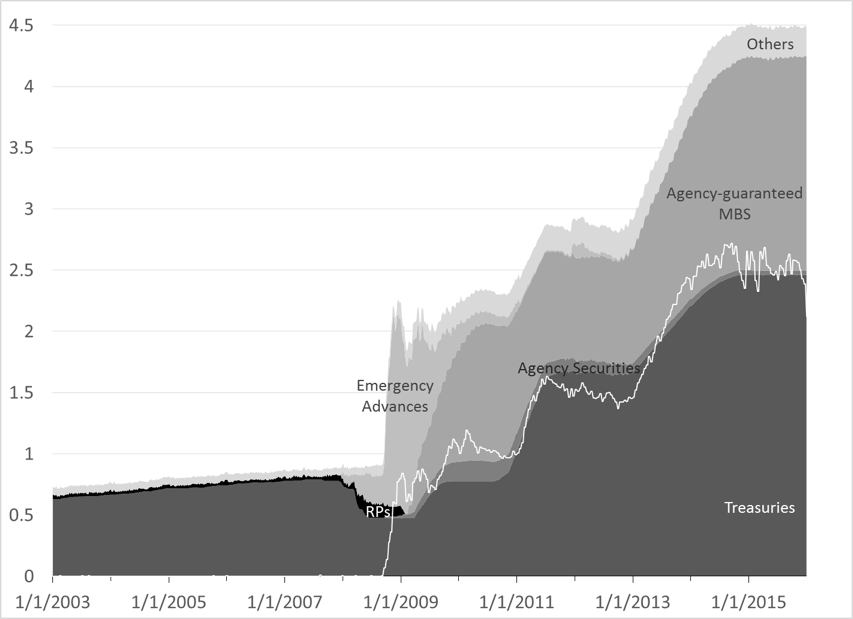
Figure 6. Assets of Fed and Excess Reserves (white line), Trillions of dollars
Source: Board of Governors of the Federal Reserve System (series H.4.1)
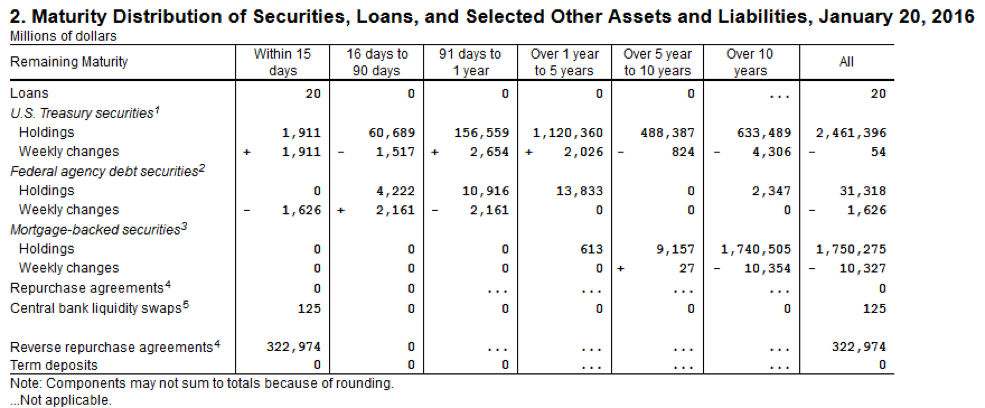
Table 1.
Source: Board of Governors of the Federal Reserve System (series H.4.1)
The Fed wants to be able to raise the FFR even though banks have ample amounts of excess reserves. To do so, it changed its operating procedures by paying interest on reserve balances (L2). This theoretically puts a floor on the FFR because if banks can earn interest on their Fed account, they do not have an incentive to lend these reserves in the fed funds market if the FFR goes below the interest rate on reserve balances (IOR).
The Fed and other central banks now operate under a “corridor” framework (Figure 7). In theory, the FFR can only fluctuate between the IOR and the discount window rate (DWR). The FFR target in set in the middle of the corridor and the three rates (FFRT, IOR, DWR) move together. There is a horizontal band instead of a horizontal line. Banks have no incentive to lend reserves if FFR is below IOR so FFR cannot fall below that. Banks have no incentive to borrow in the fed funds market if the DWR is lower than FFR so FFR will not rise above the DWR.
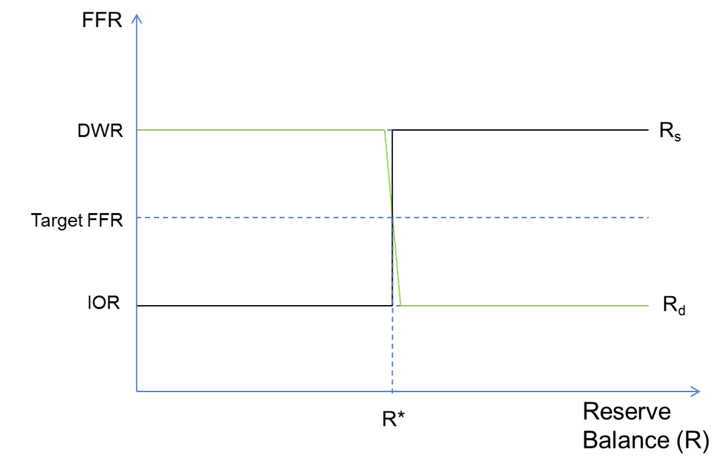
Figure 7. Corridor
In practice, the corridor in the United States is porous. In terms of the floor, other Fed accounts do not qualify to receive interest so their holders have an incentive to keep lending fed funds in the market even if FFR is below IOR. Government-sponsored enterprises (in L4), especially the Federal Home Loan Banks, were a major source of excess supply of fed funds. Since the end of 2015, the Fed has solved this problem and the IOR is a true floor. In terms of the ceiling, access to the Discount Window is highly stigmatized and contains some non-monetary costs in terms of increased supervision and loss of reputation. As a consequence, banks refrain from going to the Window even if DWR is inferior to FFR. The true ceiling in that case is the overnight-overdraft penalty rate.
Note that a corridor policy does not have to be implemented only in period of excess reserves. If a central bank wants to intervene less frequently in the overnight market, a corridor policy can be useful to limit the volatility of the overnight interbank rate. For example, the ECB has been operating that way since the beginning (Figure 8). It intervenes in the market only once a week and let the ceiling and floor do the job of containing the overnight rate around the target overnight rate during the rest of the week. Narrowing the gap between the floor and the ceiling would reduce the volatility of the overnight rate. The Fed had been on a semi-corridor since 2003 when the Fed decided to raise DWR above the FFRT and to move both in sync while IOR stayed at zero all the time.
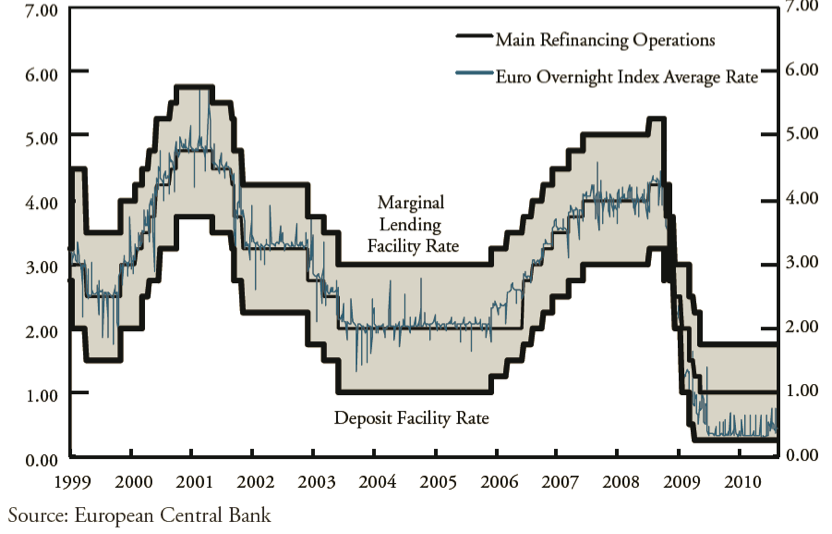
Figure 8. Corridor of ECB
Source: Kahn’s Monetary Policy under a Corridor Operating Framework
Done for today! Next blog will answer a few FAQs about monetary policy.
[Revised 7/31/2016]


12 responses to “Money and Banking Blog – Part 4: Monetary Policy Implementation”