By J.D. Alt
1. The “unsolvable” riddle of our National Budget
Being an architect, I’m fascinated by diagrams visualizing things which otherwise are invisible. In designing a building we usually begin with diagrams to explore and understand the functional and spatial relationships—the flows and often unexpected interactions—the architecture needs to accommodate. Getting the diagrams right is important—if they’re wrong or incomplete, the building we design could turn out to be a dysfunctional disappointment for its owners and users.
With this in mind, it occurs to me the reason our current Congressional leaders are having such a difficult time with our National Budgeting process is because they’re trying to design a “building” based on an incorrect diagram. No matter how they add up the numbers, they seem incapable of devising a budget that builds America forward in a positive way. In fact, their budgetary efforts more closely resemble the actions of a wrecking crew than a construction team!
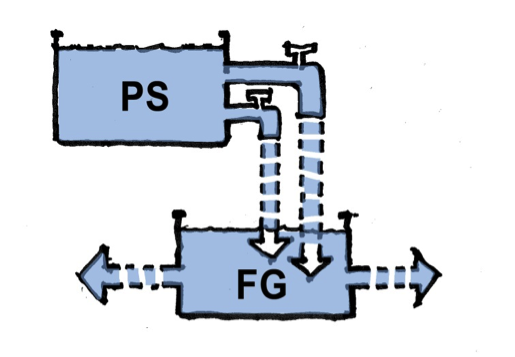
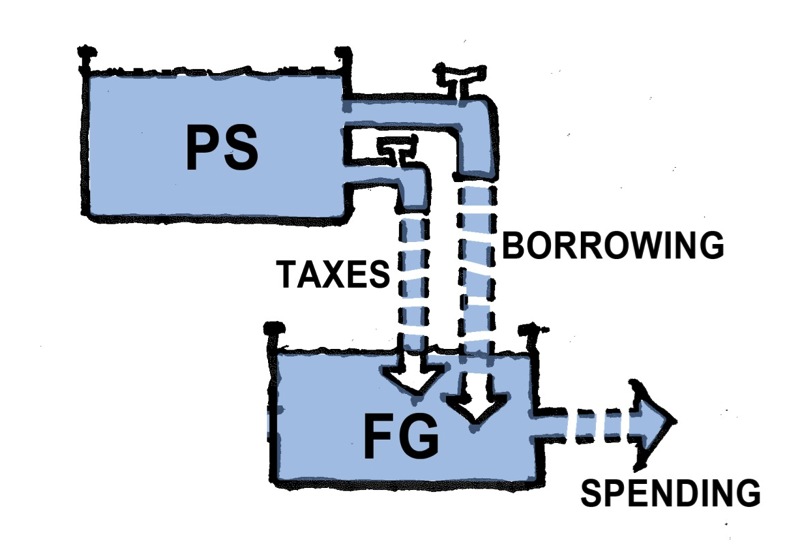
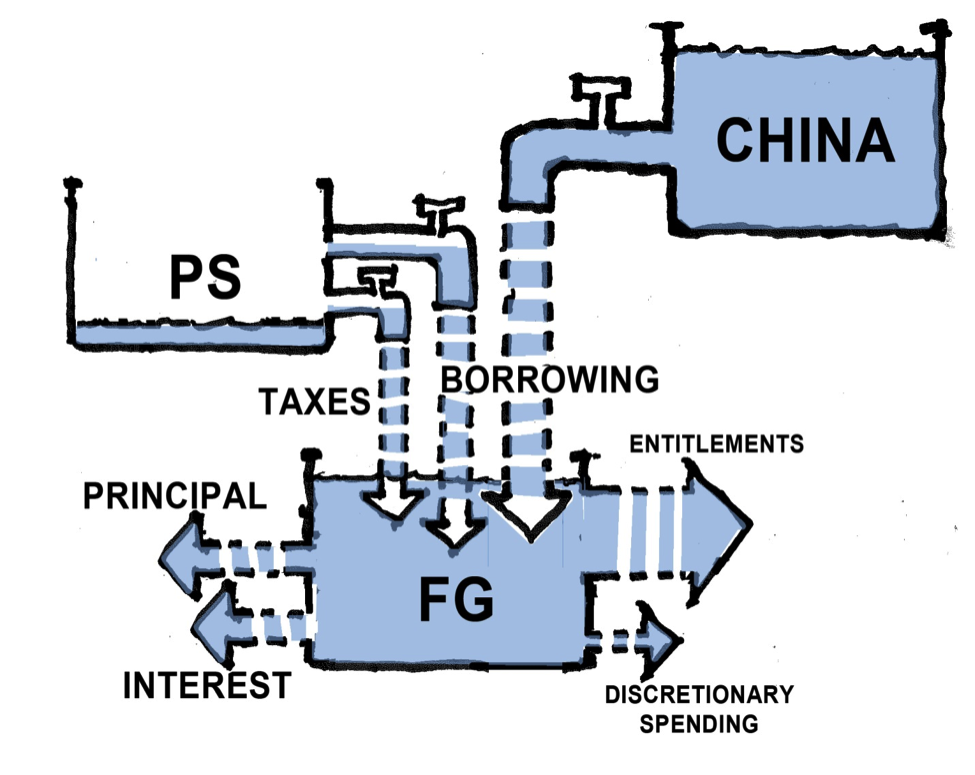
Here is my best effort to construct the diagram it appears the Congressional leaders are presently trying to use. I’m putting it together, as best I can, from the story they tell us, every day, about the fiscal dilemmas they are struggling to resolve. This diagram is also powerfully reinforced by a news media spinning and reporting daily on the politician’s seemingly futile efforts:
The main features of the diagram are two “pots” containing Dollars. One pot is labeled the Private Sector (PS). This is basically the national economy—businesses and corporations, families and foundations, state and local governments, etc. All the transactions that occur in the Private Sector (PS) pot add up to what is called the GDP (gross domestic product). The second “pot” is the Federal Government (FG), and the Dollars contained in this pot are SPENT to pay for public goods –weather forecasting, bridge repairs, Medicare services, etc.—and to make the “transfer” payments like social security, unemployment aid and food stamps that many Americans depend on to one degree or another.
The diagram shows that the Dollars in the Federal Government (FG) pot are obtained via two spigots in the Private Sector (PS) pot: one spigot is TAXES, the other is the “BORROWING” spigot through which the Federal Government (FG) obtains Dollars by “selling” Treasury Bonds to the Private Sector.
2. Diagrammatic Dilemmas
This diagram seems pretty straightforward and obvious, although there are aspects of it that are less than clear. For example, the diagram gives Congressional leaders the clear impression that the Private Sector somehow creates the U.S. Dollars we all use, though there is no exact articulation about how this occurs. The PS pot is clearly full of Dollars—they had to come from somewhere, right?—but the diagram shows no source other than the PS pot itself. There is a vague “story” about entrepreneurs investing Dollars in business ventures which make profits, allowing them to hire more and more workers, which enables them to generate more and more Dollars, etc. How the money is actually created seems to matter less than the “obvious” fact that if the two spigots draining Dollars out of the PS pot are opened too wide—if too many Dollars are drained out of the PS pot into the FG pot—the entrepreneurs won’t have enough money left to invest in creating jobs and making profits, and the Private Sector GDP (Gross Domestic Product), as a consequence, will begin to shrink.
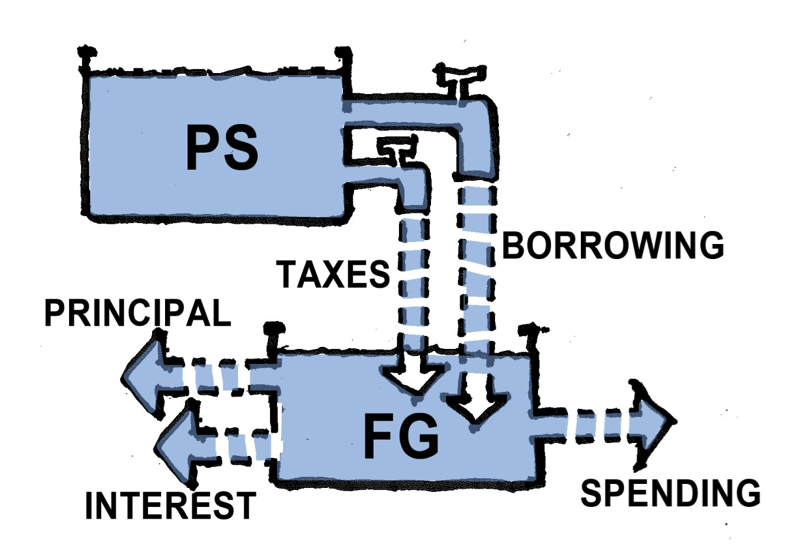
It is fear of this shrinkage that appears to constrain the number of Dollars that Congress can allow to flow into the FG pot, and this, of course, constrains the amount and kind of public goods and services that can be planned for in the National Budget. This fear is exacerbated by another which can be visualized by looking at the diagram in more detail:
As illustrated, the “BORROWING” spigot appears to require that the Federal Government not only to pay back the Treasury Bond’s principal at some point in the future, but also to pay interest on that principal. Following the logic of what we’re looking at, it appears the Federal Government will be forced to collect even more taxes at some point in the future (to pay the principal plus interest) creating a huge financial burden for our children and grandchildren. As a result, it seems clear to Congressional leaders that the “BORROWING” spigot must be carefully constrained to not exceed a certain percentage of the Private Sector pot, or else—it seems mathematically obvious—the TAX spigot ultimately will have to drain the P.S. pot completely just to pay for the government’s debt! This is what is meant when the Congressional leaders say the Federal Government’s debt is “out of control” or “unsustainable”.
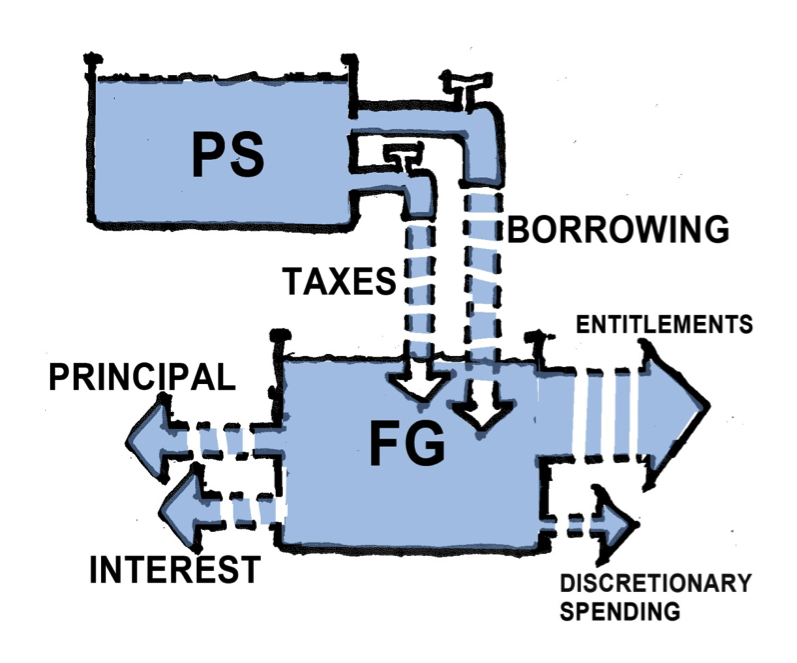
We can also look at a close-up of the FG spending side of the diagram, the side which generates the Public Goods and Services we collectively benefit from.
Looked at more closely, that spending is really of two kinds: “Entitlement” spending and “Discretionary” spending. Here too the diagram seems to illustrate the enormity of Congress’ fiscal dilemma: As Entitlement spending (Social Security, Medicare and Medicaid, Food Stamps etc.) grows larger, it has to compete with the Discretionary spending (infrastructure, education, medical research, etc.) for the limited number of Dollars that can be allowed to flow into the PG pot. Thus, if we plan to take care of our elderly, under-nourished, poorly housed, accidentally disabled, under-educated and unemployed citizens—which somehow seems an ever-growing need as the population increases and ages—our airports, highways and bridges, our water and sewer systems, our electrical grid and public transit systems, all of that (and more) must inevitably fall into disrepair.
Or, as many Congressional leaders warn us against, we’ll be forced to borrow even more Dollars from China, hastening the inevitable wreckage and bankruptcy of our economy:
It is easy to see how, using this diagram as a guide, it is literally impossible for our Congressional leaders to come up with a rational and constructive budgetary plan to build America’s future. This has got to be a big part of why, whenever they appear on television, our Senators and House Representatives are wearing such pained expressions. And, no doubt, this diagram is a large part of the reason they so relentlessly fight and bicker over every topic imaginable, because every topic imaginable seems ultimately tied to the frustrating fact that we simply don’t have enough “money”.
3. Diagram Reality Check
In order for a diagram to be useful, it has to be accurate. But how do we know if a diagram is accurate—that it reflects the actual realities we are dealing with? First, we could ask if all the “parts” have been accounted for. Maybe some important things have been left out. Then we could ask if the relationships and flows are correctly portrayed. Since our diagram seems to naturally follow a “plumbing” metaphor**, we could ask, in essence, have we got the “plumbing” right?
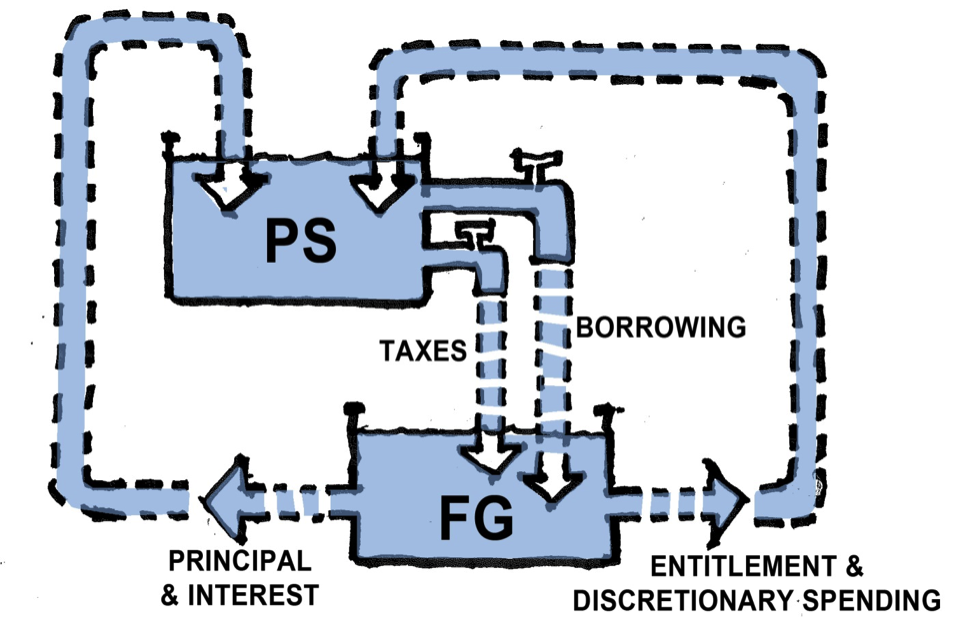
The first thing we can see pretty easily is that the diagram has, indeed, left out some key parts of the fiscal “plumbing”. The Dollars that flow out of the FG pot to pay for public goods and services—either entitlement or discretionary spending—don’t just disappear into the right page margin after they are spent. They go somewhere. They are paid to somebody. And who might that be?
In fact—and when you think about it, it’s obvious—the Federal Government buys its public goods and services from the Private Sector. Aircraft carriers and submarines are built by Private Sector shipyards. Weather and GPS satellites are designed and built by private engineering laboratories. And while the space-launch facilities at NASA are a “public” enterprise, all the scientists and technicians who work there are private citizens. Even the Navy’s Vice-Admiral in charge of sea-recovery operations, when he goes home on weekends and changes into his gardening clothes, is a private citizen.
With the exception of some payments that go to foreign contractors, the Dollars for discretionary spending, then, flow into the bank accounts of private U.S. citizens—into, that is, the PS pot. Obviously the same is true with entitlement and transfer payments: Social Security checks are directly deposited into private bank accounts, food-stamp Dollars flow into the bank accounts of farmers and food processors and distributors. Dollars for unemployment aid are used by the unemployed to buy shoes and subway tokens and cups of coffee—all going by some direct or indirect route into the private bank account of a U.S. business or citizen.
I don’t want to be overstating the obvious here, but if we change the “plumbing” of our fiscal diagram to reflect the realities just described, as shown above, it makes a significant difference in what we see.
Please note that I have also changed the plumbing on the other side of the FG pot: the “principal & interest” payments on the Federal Government’s “debt” also are deposited into private bank accounts as well—the overwhelming majority of which belong to private-sector U.S. citizens.
We still have a hopeless budgetary problem, however. Even though we can now clearly see that the government’s spending goes back into the Private Sector pot—benefiting U.S. citizens and businesses with both public goods and Dollar deposits—the amount of Dollars available for government spending is still limited to what can be “safely” taxed or borrowed out of the Private Sector pot in any given budget-year. Even though we have a better picture of the complete cycle of the fiscal flow, we still have the dilemma that if we open the TAX and “BORROWING” spigots too wide, the private entrepreneurs won’t have enough Dollars left to start ventures, create jobs, and make the profits that generate the PS pot’s money in the first place.
So our plumbing changes haven’t really solved the budgetary riddle that has Congress—and the President as well—tied up in knots. Many people will conclude that the optimum solution is to close the PS spigots as much as possible, allowing just enough Dollars to trickle into the FG pot to pay for the absolute minimum public goods and services necessary to maintain public order (and a strong military). Allowing the Private Sector to keep vastly MORE of the Dollars it creates through entrepreneurial ventures, they argue, will enable those private ventures to create more and more jobs, so there will be less need for government assistance programs like unemployment aid and food stamps. Small government and free markets are the ticket—and the diagram (even the “complete” one we are now looking at) seems to support this perspective.
Except for one problem—one fundamental flaw in the diagram’s most basic logic: it is not possible for the Private Sector pot to “generate” its own U.S. Dollars! This is because, by law, a U.S. Dollar can only be created—printed or issued electronically—by the U.S. sovereign government. Anyone else who tries to create or issue a U.S. Dollar is a counterfeiter and subject to imprisonment. This simple, undeniable, fact forces us to look at the diagram again and wonder if we really understand what is happening in it.
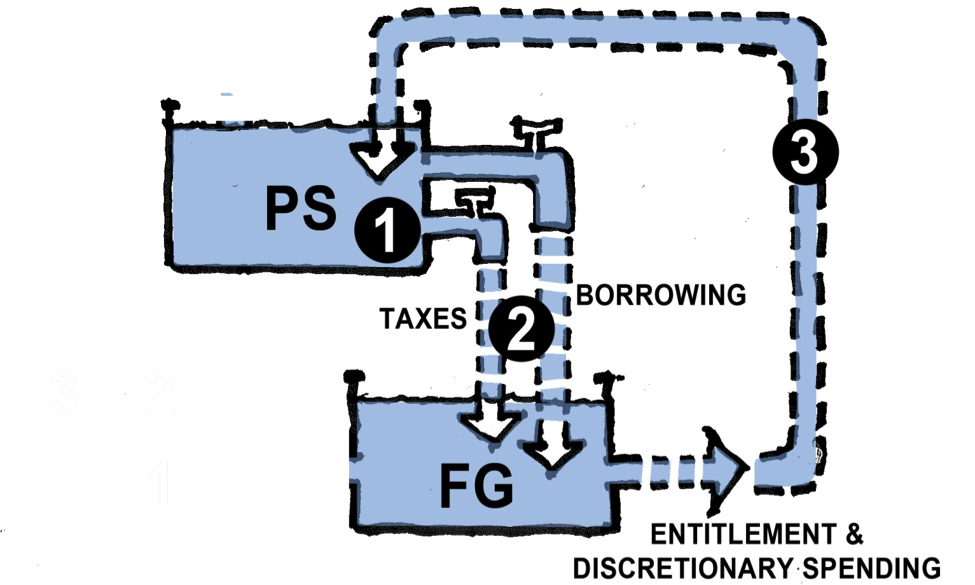
Here’s a simplified version that focuses on the direction of flow:
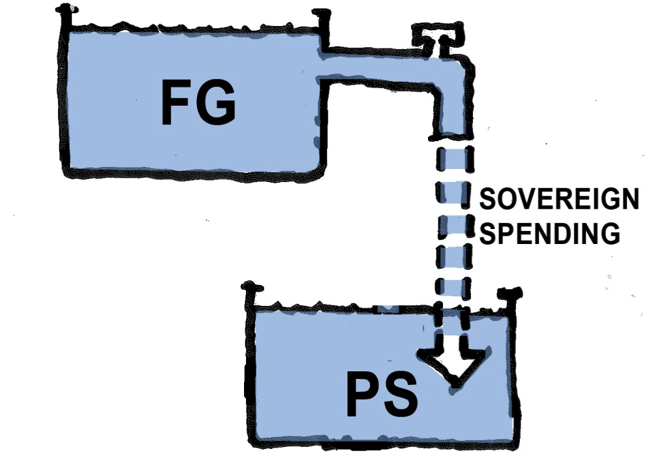
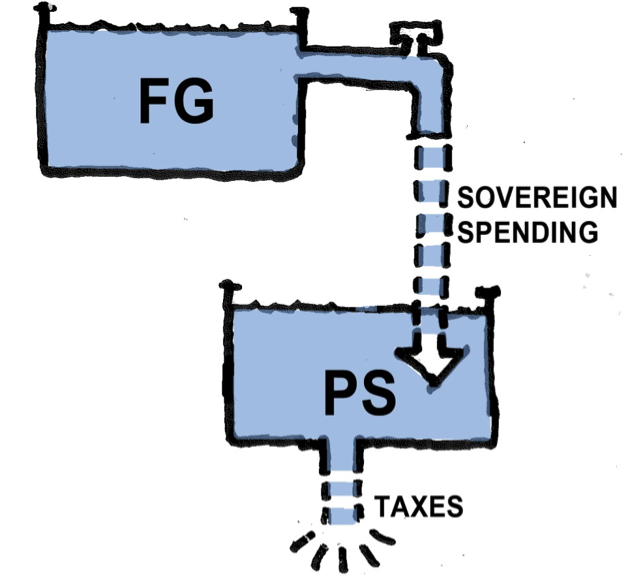
What we think we are seeing is this: Dollars get created in the PS pot and flow into the FG pot, from which they then flow, by means of government spending, back into the PS pot. The key thought-phrase here is “Dollars get created in the PS pot…” because it suggests that the PS pot is the “driver” or “generator” of the flow of Dollars. But if it is an unequivocal fact that only the sovereign U.S. Government can issue U.S. Dollars, then it must be the case that the FG pot is actually the “driver”—which means, first of all, we’ve got the diagram upside down! Basically, it should look like this:
4. Hmmmm…?
What we are seeing now is a completely new fiscal perspective: The sovereign government issues U.S. Dollars in the FG pot and then spends those Dollars through it’s own SPENDING spigot into the PS pot! Entrepreneurs in the Private Sector then use the Dollars the FG has issued and spent—leveraging them with bank loans and creative financing—to launch business ventures that generate private sector jobs and wages. Can this possibly be the way it actually is? Let’s see.
Before looking at this new diagram in more detail, let’s consider its most basic implication: As the FG spends, the number of Dollars in the PS pot grows. If the number of goods and services available for people to buy in the PS pot does not grow by an equivalent amount, the additional Dollars flowing in will cause prices to go up—perhaps dramatically. This is the “inflation” that Congressmen and economists are constantly warning against. To prevent this from happening—or to prevent the rate of inflation from getting disruptively high—there has to be some means for taking Dollars out of the PS pot.
This essential REMOVAL operation is accomplished with two pieces of “plumbing” we can now add, one at a time, to the new diagram:
The first plumbing addition is a “drain” that simply takes Dollars out of the PS pot and destroys them. This drain is Federal Taxes. Drained out and destroyed, Dollars paid in Federal taxes are no longer available for Private Sector spending—and, therefore, can no longer contribute to price-inflation.
Obviously, this plumbing feature—the TAX DRAIN—needs some further explanation: Why would the Sovereign Government destroy the tax Dollars it collects? Doesn’t it need those tax Dollars to pay for its spending? Shouldn’t the “drain” really be a sump-pump that lifts the tax Dollars back up and dumps them into the FG pot?
It would be a mistake, though, to add the “sump-pump” plumbing to our diagram. The reason is the underlying reality of what a U.S. Dollar actually is: It is simply a promise, by the U.S. sovereign government, that it will accept the Dollar as payment for a Dollar’s worth of taxes. That’s it. A Dollar—whether it’s a paper Dollar or an “electronic” Dollar—is nothing more than that promise. The sovereign government doesn’t promise to exchange a Dollar for gold or silver, or for anything else of intrinsic value. It promises only to accept the Dollar in exchange for the cancellation of a Dollar’s worth of taxes due. In other words, a Dollar is the I.O.U. of the sovereign government. The Dollar says: “I owe you one Dollar’s worth of tax credit.”
This I.O.U. means a lot more to all of us in the Private Sector (households and businesses) because we also use this I.O.U. Dollar for our MONEY—we use it to buy goods and services from each other, to invest in business ventures, and to save for future spending in our retirement. But at its most official heart, the U.S. Dollar is simply the I.O.U. promise of our sovereign Federal Government.
This underlying reality of what a Dollar actually is has a lot of importance for our new Diagram. First, it tells us why we (all of us citizens working in the Private Sector) are willing to accept Dollars in exchange for our very real goods and efforts: Because we need those Dollars in order to pay the taxes we owe the Federal Government! We can’t pay our taxes with apples or Pesos. We can only pay our U.S. Taxes with U.S. Dollars. So that’s why the FG SPENDING spigot works in the first place—because all the citizens and businesses in the Private Sector are willing to provide goods and services to the Federal Government in exchange for the Dollars they need to pay their Federal Tax bill.
The second thing the underlying reality explains is why the Dollar is “destroyed” when it is used to pay U.S. Taxes. You give the Federal Government back its I.O.U., the FG declares your taxes paid, and the I.O.U. is cancelled. That I.O.U. is of no further use to the Federal Government. It is illogical for the FG to “keep” an I.O.U. that says it owes something to itself. It could recycle the I.O.U. and use it to buy new goods and services from the Private Sector. But even that is illogical, because it is far easier and more efficient, when the Sovereign Government needs to spend again, for it to simply issue a new I.O.U. This is especially true since the vast majority of Dollars issued and spent are electronic—simple keystrokes on a computer screen.
So the “TAX DRAIN” really is the correct diagram! Federal taxes drain Dollars out of the Private Sector pot and—POOF!—they’re gone. How many Dollars should be drained every year to keep price-inflation in check is a crucial question, but we don’t need to answer that to get our diagram right. We do need to add some additional plumbing pieces, however. This is because there is a another, very important, means for taking Dollars out of the PS pot to control inflation.
**I am indebted to L. Randall Wray for first illustrating his “bathtub” metaphor in his book, “Modern Money Theory”.
Let’s face it – the overwhelming logic and simplicity of these diagrams are way beyond the comprehension of most conventional “economist”, and certainly, beyond the intellectual level of most congressmen and women.
Brilliant!
You’ve hinted at a follow-on, which I’m guessing will include changing the FG to just a pipe rather than a reservoir, so as not to imply a limited capacity that must be refilled; and another PS drain for savings (private and foreign).
And there’s a typo, you have a PG that should be FG.
Now that I see the title again, I guess it was more than a hint.
While the above illustrations are clear and logical, there seems to be a missing factor in the diagrams. Where is the plumbing from the private sector banks that feeds “money” into the private sector – “money” that is not created by the Government sector? Although I don’t have any figures for the quantity of this “money” created via the fractional reserve banking system, from available data, it seems it is actually much larger than the amount of sovereign money created by the Government.
Thus, some of the “money” the government acquires thru taxes and borrowing has to include this “fictional money” created by the banks. Although conventional thinking tends to blame Governments for the continual boom and bust cycles, it seems far more accurate to sheet home the blame to the private banks and the Government condoned, fractional reserve system. It is the, basically, uncontrolled creation of this “fictional money” that causes inflation and/or deflation, according to the private bank policies.
Until that spigot of inflow is somehow related to the productive capacity of the nation, and the related goods and services available, boom and bust cycles will be an ongoing feature of every economy.
@Guggzie, I posted something along the same lines below.
The UK organisation, Positive Money, suggests that 97% of all money (in the UK) is debt-based money created by private banks.
I am very interested in MMT, but increasingly fristrated that this huge gap in the sory is not being addressed. I may be missing something obvious, but if so, I wish someone would point it out and show me how MMT does deal with the “missing” 97%.
That 97% is not missing from MMT (although it is not covered in these simplified diagrams).
MMT postulates a hierarchy of money, an inverted pyramid with the government at the apex, then banks, then corporations and individuals.
Anyone can create money, and Minsky famously said “the trick is to get it accepted”. The government more or less guarantees that bank money trades at par with government money. The debt of (money created by) corporations and individuals trades at a discount to bank money, which is why you have to pay interest to get a loan from the bank.
If you think of the water in the diagrams as net financial assets, it is more strictly in compliance with MMT, and you don’t have the same problem with different issuers of “money”.
Good stuff.
This ignores the creation of money by private banks. The vast majority of money in circulation is created within the PS. I realise that this is balanced by an equal amount of debt, and so nets to ero, but nevertheless, it is misleading to say that only the government can create dollars. Only the government can create dollars that are not credit, with an equal amount of debt. But since the majority (90% plus) of the dollars being used are these private, debt fuelled dollars, to ignore them gives a false impression of the system.
The whole financial crisis is a result of the huge increase in the money supply as a result of private banks creation of money as loans. No answer to the current issues can arise without addressing this, so although I think your metaphor is useful, I think you need to acknowledge the elephant in the room.
Very well done. Simple but elegant. Should be required reading for every member of our legislative branch. Also useful to have an informed electorate. Ties in well with this short video of Pavlina Tcherneva promoting growth as a byproduct of employment rather than trying to make employment a trickle down effect of growth..
Aren’t you forgetting the creation of dollars from debt via the banking system, or do you view that also as FG “spending” into the economy?
My point exactly Geoff. To me, it is impossible to talk about the monetary system without including the huge amount of “fictional money” created by the private banks. As I said in my earlier post (still awaiting moderation) this “fictional money,” apparently, far outweighs the amount created by the Government. If anyone can provide the comparison between money created by the private banks compared to money created by the government, it would greatly add to this discussion.
As for taxes; more than anything, they are an essential tool of every government in controlling the people – they were essential under a gold standard economy, and they do serve to manipulate inflation, but I disagree that they are the necessary adjunct for creating a money supply. A society needs a convenient and guaranteed medium of exchange, and who better to provide that guarantee for the nation than the Government? It’s certainly not the private banks using the fractional reserve system – it has been proven time and time again, no private bank can sustain a run on any bank.
I read a post I recall was from an economist at Boston U. that banks “owe” depositors a total near 19T$. They do not have the cash to settle these accounts. The article asserted if banks were made trust institutions, losing the fractional reserve method, then banks would need to borrow the 19T from the FG thereby wiping out the federal debt plus a few T$.
Do not the depositors owe the banks far more than $19T? Seems to me the banks could simply use a portion of their assets to wipe out all their liabilities, and have equity left over. If individual banks cannot do that (mathematically, not necessarily contractually), the government calls them “insolvent” and closes them. They wouldn’t need to borrow anything (unless they thought borrowing was better for their business), just cash in some assets.
I found the link to the article I was quoting. It is an excellent article by Laurence Kotlikoff, Boston University
The URL is: http://realmoneyecon.org/lev2/answers.html
The part I remembered (taken from the above URL) was:
A. Trust Banking System
Under this system, banks would be divided into 2 totally separate parts or “windows”, one being the trust depository side and the other the credit side (lending and investments). In effect this could be called “Glass-Steagall on steroids”.
Guggzie
I don’t think we will get anywhere referring to bank created credit money as “fictional”. Better not to use those types of pejoratives I think and simply talk about the different nature of bank created credit money and the govt money which comes with no loan. Most of the money circulating is of the bank created type so if its fictional, the entire system is fictional and thats not a good place to start a discussion in my view.
The hybrid system we have can be better directed to public purpose and that is where we need to focus I think. I think MMT has some very good suggestions for focusing our public purpose and we need to hammer those home everywhere we can
An electronic engineer would do it differently but the result would be the same. Thanks for a great educational tool.
Pingback: Diagrams and Dollars: Modern Money Illustrated (Part 1) | naked capitalism
Pingback: DIAGRAMS & DOLLARS: modern money illustrate...
Dear Mr. Alt, or J.D. if first names are OK, and I get it right,
Congratulations on a tremendous step forward in the battle to bring reality to economic
discussions of budgeting! Graphs like yours well help a great deal!!!!
I hope you do not mind my suggesting one further step, a simplification to essentials.
I suggest that you one present one or two graphs showing how money does work,
with only the slightest mention of the incorrect views widely held.
An exposition of that sort could have a profound effect.
I work bringing physics and mathematics to biologists and medical students,
in research and teaching. We are constantly dealing with pre-judgments about
how things work that are wrong. (Heavy objects do not fall faster than light objects.
Humans are not well or intelligently designed: systems like the respiratory system are designed
as badly as one could imagine, breathing in and out of the same pipe. Having a
separate exit for air from the lungs would increase efficiency by thousands of
times, as it does in gills.)
We find that presenting a correct drawing and metaphor AND STICKING WITH IT works very well. Discussing what is wrong with the old metaphors does not work well with most students, but is essential with the few students who ask the question “What was wrong with the old view?”
Congratulations again and best of luck!!
SIMPLIFY and STICK WITH IT.
Persuade your colleagues to show your single simplified graph and we have moved a long
way forward.
As ever,
Bob Eisenberg
Bard Endowed Professor and Chairman
Department of Molecular Biophysics and Physiology
Rush University Medical Center Chicago
Web Page: http://www.phys.rush.edu/RSEisenberg/physioeis.html
CV: https://ftp.rush.edu/users/molebio/Bob_Eisenberg/Reprints/Webpages/Full.CV.pdf
I totally agree with your comments to take the positive approach rather than being reactive to what is wrong. Obviously, we need to analyse what is wrong before we can propose a solution, but once a solution is found, that is what needs to be promoted. Likewise, in you post in Part 2, repetition is the key to changing minds, hence, rather than continually talking about “Government deficits” it would help to change the term along the lines you suggest, “Government Investment”.
Thanks!!
I doubt if I said anything you did not know better than I do!
Thanks for your politeness in answering.
We are all VERY lucky to have you in this battle!
I strongly agree with Bob. “I suggest that you one present one or two graphs showing how money does work, with only the slightest mention of the incorrect views widely held.”
If you want to shift the current paradigm, you need to stop repeating the erroneous models/assumptions. Why?
Because you reinforce the errors/incorrect assumptions when you repeat them.
State the new correct models/diagrams/assumptions succinctly and clearly as you have done here, and repeat frequently.
In other words, you want to reinforce the correct information – not the incorrect information.
This analogy with diagrams is brilliant.
Thanks for your Plumbing Diagram. Can’t wait for PART TWO xxx
Pingback: Diagrams and Dollars: Modern Money Illustrated (Part 1) | Jo W. Weber
Thank you. We can’t wait for Part II. When do you think it will be ready?
Technically, if the Govt were running a balanced budget, the private sector can still grow its own pot of “effective” US dollars (aka bank deposits) through increasing leverage off of the now static pool of “state money”. Of course this is unsustainable in the long run, but in fact the private sector can create its own “effective” US dollars because banks have been given official authority to create “effective” US dollars via Govt guarantees of what are otherwise private bank currencies.
Unless you consider the debt to be negative dollars. The dollars coming to the PS from FG have no negative offset in the PS, as bank loans do. Loans increase negative dollars at the same time and in the same amount that they increase “effective” dollars.
Of course you are right from an accounting POV John, but the reality is that those “negative dollars” essentially occur over time. The negative is all the future income you are committing to today’s purchase. But that still means that those “positive” dollars were created and spent today, and the negative dollars or book entry are diminished over time. A good amount of new debt (as a % of the whole) is from 15 or 30 year mortgages.
Say, we had an influx of 50 million immigrants that can’t conceive and none die for 31 years all at once. And they all took out 30 year mortages. The money supply would skyrocket this year and then slowly shrink over time. Positive money today and negative money for the next 30 years. Which describes my initial point further, which itself was accurate, I did say “unsustainable in the long run” after all. I just think its important we acknowledge the private sector’s ability to create dollars as well.
The diagrams are an incomplete view of reality, and an overview without detail. It’s not a complete macroeconomic theory. There are other things missing, like a foreign sector, savings other than T-bills, the entire real economy. The topic is the government budget, the nature and effects of government spending and taxing, the flows between the government and private sector, not within the private sector. The point is made, and is valid with or without private banks, with or without a central bank. Further points can be better made using other tools.
Fair enough John, JD Alt’s diagram is obviously not a complete theory. In my original comment I certainly wasn’t trying to demean the article or criticize it in any serious way, I thought it was good after all. I was just making a simple observation to remember about the potential size of the PS pot. My comments were both right and accurate, and the diagram can be accurate for what it is also, and these two things can be both be true simultaneously. So no conflict there.
In my reply to you, I realize that maybe we are just talking past each other here and not really addressing each other’s intended points. So let me try again:
I would say that the thing that “negative offset” to 97% of all Govt spending is an equal reduction in bank deposits either through taxes or T-bond purchases. The T-bond offset maybe negative in terms of bank deposits, but it is not in terms of financial wealth. Hence, the NFA portion of things. But NFA’s and bank deposits are two separate but related things.
Given the argument presented by this post, can’t we just eliminate the use of the words “deficit” and “surplus” when referring to the Federal Government’s books? Don’t they just serve to perpetuate the fundamental misunderstanding this post is attempting to clear up?
Well whether the government runs a deficit or a surplus or a balanced budget it will have a dynamic or active effect upon the economy so you might argue that the government’s manipulation of its balance sheet creates an “activator” of some type, positive, neutral or negative.
Also since money represents “scoring points” with “scoring” meaning “marking on balance sheets” and these “points” being increasingly electronic and therefore rapidly and usually automatically marked and communicated we also need to recognize that these points can be assigned different values according to the currency they are created in. The points as variables can be changed organically by markets or manipulated artificially by governments and private banks. So, for example, the Chinese renminbi is operated like a “Reverse Tariff” where government controlled banks remove any inflationary pressures from foreign demand for the currency and invest the removed points in foreign government Treasury Bonds usually US government bonds since keeping the US as its main customer flush keeps the factories running in China.
China accordingly uses its “activator” to maximum economic activity within its domestic economy in true Functional Finance fashion which has the effect of making its “consumer points” more valuable because of the growth in competitive enterprise it encourages but makes sure its “foreign consumer points” are generally kept pegged and stable again to encourage yet further growth in competitive enterprise within its own domestic boundaries.
If we aspire to equitable and stable growth throughout the world we need as a species to address our understanding of the sovereign government “activator”, the manipulation of “points” and the regulation of private banks in regard to potential effects on these two factors. We appear to be at an early stage of understanding the interactive effect of these various factors.
@ Guggzie and Zoltan Jorovic
The most direct answer was hinted at in another comment, but is that all of the private sector transactions eventually net out to zero (credit and debit entries.) We don’t need the term “fictional money.” We can simply call all private sector creation “credit.” The private sector either reconciles the transactions electronically, or leverages the federal circulating money to resolve financial transactions. The diagrams didn’t leave anything out.
Great model!
//cheers.
I have been thing about the last diagram showing the Federal Government supplying money to the public sector. I think the Federal bath tub should be void of water. As Warren Mosler writes “The Federal Government doesn’t ever ‘have’ or ‘not have’ any dollars. ” I think the water should magically appear at the tip of the faucet.
What this really drives home for me is how bad the concept of austerity really is. One look at the diagram and you can see that if you turn spending off and open the tax drain all you logically end up with is an empty PS.
Equally so, the converse of that becomes clearly and more articulated. Increasing spending while decreasing taxes fill the PS with aggregate demand.
What it doesn’t cover, and I hope is in part 2, is how spending is divided up on the PS and how and who controls those flows (campaign contributions and such).
I really chalk this diagram up to framing just how wrong the right’s economic mindset is, and how the greatest lie cing from them is the in/out flows of money in the economy.
This is a little like a mechanical model I developed a few years ago to educate investors. The model used a steam pressure metaphor instead of water. In a nutshell, money enters the system from new bank credit and government spending, positive trade, disavings, and leaves through the opposite processes. The economic pressure from this money runs through the domestic circuit like steam through a turbine. The pressure can vent out of the system through import trade circuit or investment spending circuit, or through savings. Pressure that can’t inflate economic growth or leave through imports and or asset investment is vented off through goods and service inflation. The money pressure will always inflate either economic growth, asset prices or consumer inflation. Asset prices additional collateralize more loans and create more money. It’s too complicated to explain here, but for those interested in mechanical models, you can see the diagrams and learn more here. http://www.scribd.com/doc/126225219/Money-Pressure
If tax money is sent to a blackhole, then it is a lie when they say your tax money is used to pay for stuff like the salary of public workers, building and maintaining public infrastructure etc?
More likely ignorance, caused by the teaching of traditional economics, and passed on to those not taught it in school.
Exactly. And changing that sort of thinking is one of the main reasons it is difficult to communicate the MMT message. Taxes are used to give value to a currency and to stave off inflation. They are now being improperly used to support the FIRE sector encouraging bad corporate and asset accumulation behavior. They could be used to give better incentives to productive business activity.