By L. Randall Wray
In a Wall Street Journal article this week three Hoover Institute economists (Gary Becker, George Schultz and John Taylor) endorsed Republican efforts to make large federal government budget cuts. I will not address all the arguments made in defense of a “Hooverian” approach to economics (we tried that in the early 1930s!). Here I want to focus on the two main points made:
- “When private investment is high, unemployment is low. In 2006, investment—business fixed investment plus residential investment—as a share of GDP was high, at 17%, and unemployment was low, at 5%. By 2010 private investment as a share of GDP was down to 12%, and unemployment was up to more than 9%. In the year 2000, investment as a share of GDP was 17% while unemployment averaged around 4%. This is a regular pattern.”
- “In contrast, higher government spending is not associated with lower unemployment. For example, when government purchases of goods and services came down as a share of GDP in the 1990s, unemployment didn’t rise. In fact it fell, and the higher level of government purchases as a share of GDP since 2000 has clearly not been associated with lower unemployment.”
The authors supply a graph showing investment and government spending as a share of GDP to demonstrate these two points. Based on that data, these economists argue that the solution is to cut federal spending and then to hold its growth rate below that of GDP. This will allow the share of government spending to fall—while economic growth will let tax revenues rise a bit faster so that the budget will move toward balance.
By framing their argument in terms of ratios to GDP, the authors provide a misleading characterization of cause and effect. It is true that high investment spending tends to increase GDP while lowering unemployment—that is the Keynesian “multiplier” at work. High growth of GDP, in turn, lowers the ratio of government spending to GDP so that we will observe a correlation between falling unemployment and a falling government share of GDP—but that is a correlation of no causal significance. When an investment boom collapses—as it did in 2006-2007—GDP growth then falls and the government share of a smaller GDP will rise. Our Hooverians interpret that as “proof” that a rising government share does not help to fight unemployment.
In fact, however, relatively stable government spending over a cycle helps to cushion a private sector “bust”. While it is hard to prove the counterfactual—how bad would things have been without sustained government spending—it is hard to believe their argument that a loss of 8% of GDP due to reduction of private spending would not have led to a much deeper recession (or depression) without the stabilizing force of our government spending.
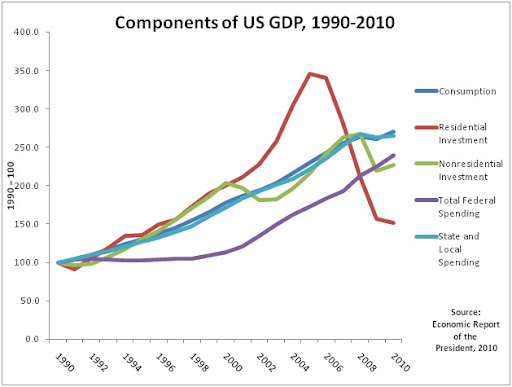
Let us take a look at the components of GDP over the past two decades. Recall from your Econ 101 course that the aggregate measure of a nation’s output of goods and services (GDP) is equal to the sum of consumption, private investment, government purchases, and net exports (for the US that is of course negative). We can further divide investment into residential (housing) and nonresidential (investment by firms). Finally, we can divide government spending between federal government and state and local government. The following chart graphs the domestic components of GDP (net imports are left out), indexing each component to 100 in 1990. (This makes the scale easier to show in the graph, and simplifies comparison of growth by component. For example, if consumption spending doubles between 1990 and 2000, its index increases from 100 to 200.)

What we see in this graph is that the slowest growing component over the two decades was federal government spending—it actually did not grow much until the term of President George W. Bush. (A substantial portion of federal government growth since 2000 can be attributed to our multiple wars, as well as to domestic spending on security.) By 2010, federal government spending was just over 2.3 times bigger (in nominal terms) than its spending in 1990. Private consumption as well as state and local government spending grew steadily, increasing by about 267% before the deep recession led to some retrenchment. By contrast, residential investment boomed in the real estate bubble, growing by 350% until 2005. It then collapsed so that it stood at an index of just 150 in 2010 (fifty percent higher than in 1990). Nonresidential investment shows a clear cyclical nature, and it too collapsed in the aftermath of the global financial collapse. Viewed in this light, it is not at all surprising that when total investment (residential plus nonresidential) is growing rapidly, unemployment tends to fall; but when investment spending collapses we lose jobs at a stupendous pace.
This has long been the concern of Keynesian economists: investment by its very nature is highly cyclical, subject to what J.M. Keynes called “whirlwinds of optimism and pessimism”. That is not all bad. J. Schumpeter referred to the “creative destruction” that makes capitalism dynamic—waves of innovation generate new investment, wiping out firms that get left behind. But if an entire economy is whipped about by unstable investment, we oscillate between the extremes of boom and bust. That is why we need some spending that is more stable—better yet, we need a source of spending that can act in a countercyclical manner to offset the swings of investment.
And that is precisely what we created in the aftermath of the Great Depression. First, we grew the federal government—from about 3% of GDP in 1929 to above 20% after WWII. As the chart above shows, federal government spending is not subject to the wild swings that afflict investment, so it helps to stabilize GDP and jobs. Second, we put in place a variety of federal government programs that help to stabilize household consumption (unemployment benefits, Social Security retirement, and “welfare” for households, firms, and farms). That is, again, reflected in the chart above—even when the financial sector crashed and unemployment exploded, consumption dipped only slightly, thanks in large part to government “transfer” payments like unemployment benefits.
Our modern Hooverians would like to return to the “good old days” of President Hoover, when the government was smaller and both unwilling and unable to offset the swings of private investment spending. Back then, when investment collapsed unemployment did not go to 9 or 10 percent, it went all the way to 25 percent. Hooverian economics would turn back the clock to ring in another Great Depression with the same old pre-Keynesian ideas that failed us in the 1930s.