
Due to the size of this post, it has been split into 2. You can find part A here.
Monetary instruments
Monetary instruments are the last type of marketable promissory notes. Post 15 and Post 16 are devoted to their analysis. One of the main characteristics of monetary instruments is that their term to maturity is instantaneous, that is, they can be returned to the issuer at the will of the bearer. In terms of cash, that is physical monetary instruments, the Financial Accounts of the United States make a difference between currency, Treasury currency, and coins. Coins are not included in the Accounts, currency refers to cash issued by the Federal Reserve (Federal Reserve notes), and Treasury currency refers to cash issued by the US Treasury (the Treasury no longer issues any currency but some of it still circulates). Unless stated otherwise, the term “currency” will be used to include paper-made monetary instruments issued by both the Federal Reserve and the Treasury. In 2015, the outstanding dollar amount of currency was $1.5 trillion and Figure 18.20 shows that 95 percent of it was held by the domestic non-federal sectors and the rest of the world. In 2015, about 40 percent of the US-dollar-denominated currency outstanding was held by the rest of the world, and about 55 percent was held by the domestic private sector. The ownership structure of Treasury currency outside the Federal Reserve is not provided by the Financial Accounts, but most of it must be held by the domestic private sector. The Federal Reserve is a significant holder of Treasury currency although the significance of its holding has shrink over time. In 1945, Federal Reserve’s holding of Treasury currency represented about 10 percent of outstanding currency, but, by 2015, it represented less than 5 percent of outstanding currency.
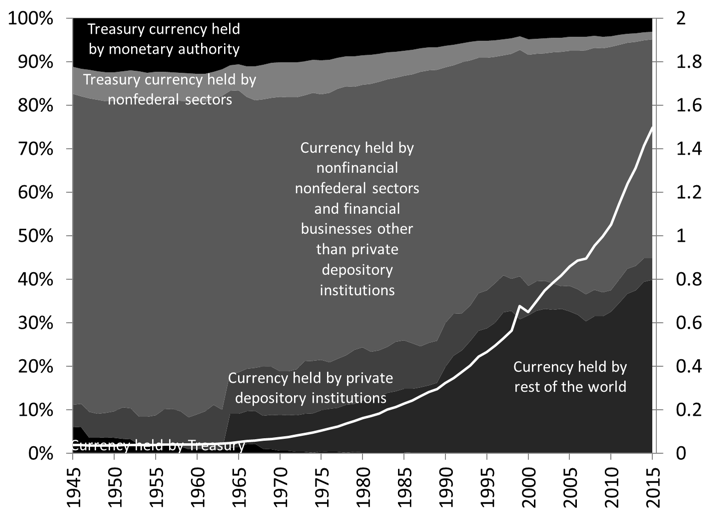
Figure 18.20 Structure of ownership (percent) and level (trillions of dollars) of US currency and US Treasury currency
Source: Board of Governors of the Federal Reserve System (series Z.1)
Note: Currency means Federal Reserve notes, Treasury currency includes banknotes non-longer issued by the Treasury but that the Treasury did not demonetize (United States notes, silver certificates, pre-1933 Federal Reserve notes convertible into gold coins at the Treasury, among others)
Beyond currency, another familiar monetary instrument is the checking account (aka checkable deposit) and their outstanding amount was slightly less than $2.5 trillion in 2015. Checking accounts are held by all sectors of the economy and again the rest of the world has held a growing proportion of US-dollar denominated checking accounts (Figure 18.21). Following the definition of the Financial Accounts, currency (Federal Reserve notes) and checkable deposits have been issued by two entities, the private depository institution (private checking accounts) and the Federal Reserve (currency and checking accounts issued to the Treasury, government-sponsored enterprise and the rest of the world). Figure 18.22 shows that from 1945 until 1990, the checking account issued by private depository institutions represented 75 percent of outstanding checkable deposits and currency. Since 1990, the proportion issued by the Federal Reserve has risen to reach 40 percent of outstanding currency and checkable deposits in 2015.
If one moves away from the narrow definition of checking accounts used by the Financial Accounts to include all existing checking accounts and currency outstanding in the Financial Accounts, then one must include the checking accounts issued by the Federal Reserve and the Federal Home Loan Bank to private depository institutions. One must also include currency in the vault of private depository institutions. Figures 18.23 and 18.24 show the implication of including these elements in the statistical analysis. The 2015 outstanding amount of checkable deposits and currency jumps to $6 trillion instead of $4 trillion (see Post 4 for an explanation). The proportion of currency and checking accounts held by banks had been declining from 1945 until 2008 to less than 10 percent of the outstanding dollar amount, but the financial crisis led to a jump to 40 percent of all currency and checking accounts. From 1945 and until 1990, the Federal Reserve had issued about 30 percent of the outstanding currency and checking account, this proportion rose slowing in the 1990s and jump to 60 percent following the 2008 financial crisis.
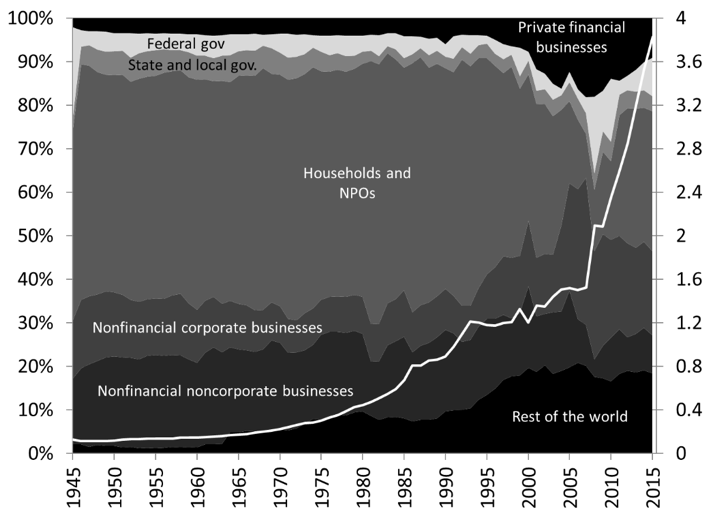
Figure 18.21. Structure of holders (percent) and level (trillions of dollars) of checkable deposits and currency held by all sectors except private depository institutions
Source: Board of Governors of the Federal Reserve System (series Z1, Table L. 204)
Note: Checkable deposits held by private depository institutions at the Fed (“reserve balances”) are not included in the Financial Accounts’ definition of checkable deposits. “Private financial businesses” includes checking accounts issued by private depository institutions that are held by security brokers and dealers, government-sponsored enterprises, pension funds, insurance companies, finance companies, money market mutual funds and real estate investment trusts.
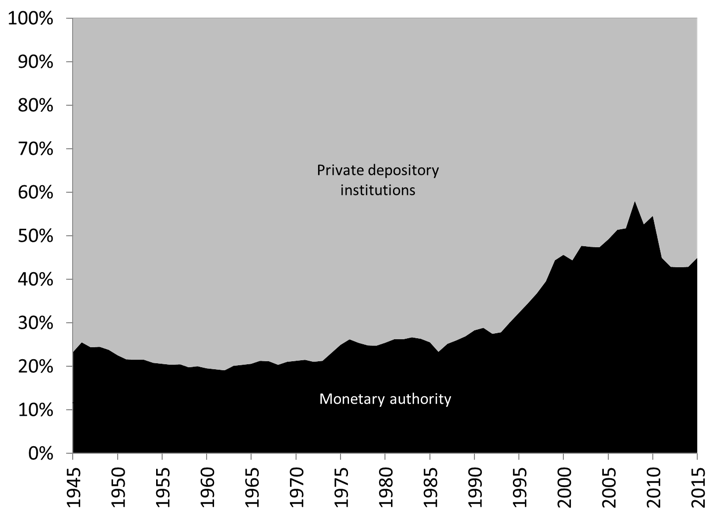
Figure 18.22 Structure of issuers of checkable deposits and currency held by all sectors except private depository institutions
Source: Board of Governors of the Federal Reserve System (series Z1, L. 204)
Note: Monetary authority issued checkable deposits to the Federal government, the rest of the world, and government-sponsored enterprises. Checkable deposits issued by the Federal Home Loan Banks to private depository institutions are not included in Table L.204, checkable deposits issued by the Federal Reserve to private depository institutions are also not included.
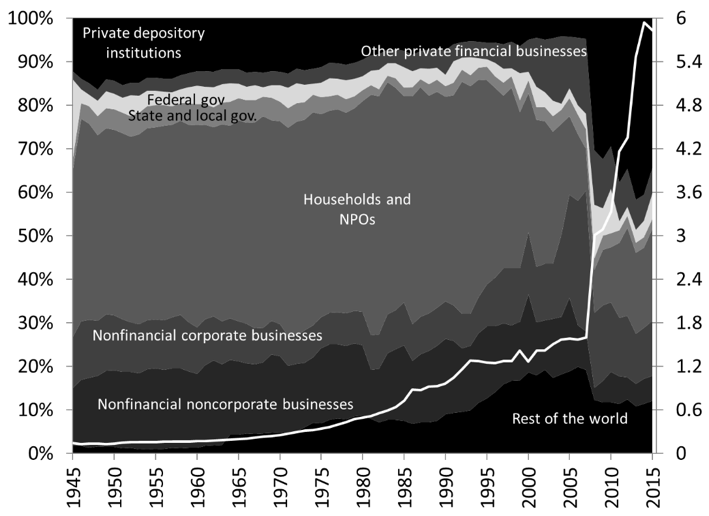
Figure 18.23 Structure of holders (percent) and level (trillions of dollars) of checkable deposits and currency held by all sectors
Source: Board of Governors of the Federal Reserve System (series Z.1)
Note: “Other private financial businesses” are the same as “private financial businesses” in Figure 18.21.
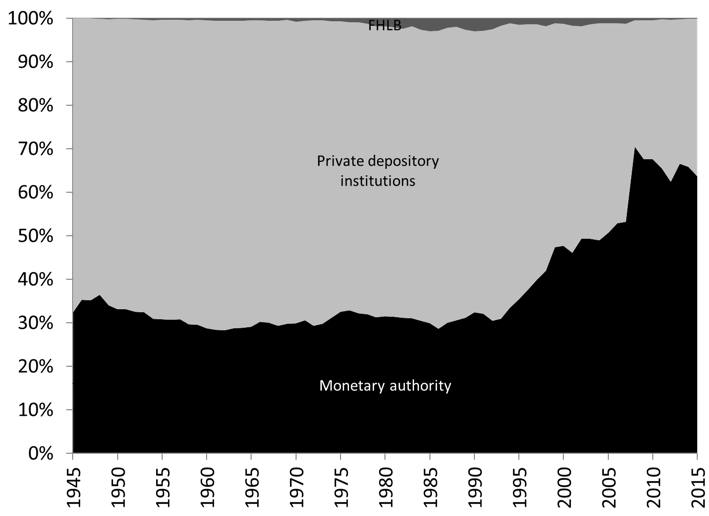
Figure 18.24. Structure of issuers of checkable deposits and currency held by all sectors, percent.
Source: Board of Governors of the Federal Reserve System (series Z1)
Note: Monetary authority issued checkable deposits to the Federal government, the rest of the world, and government-sponsored enterprises, and private depository institutions.
Non-marketable promissory notes: An overview
While many promissory notes can be traded among bearers, there is also a large number of promissory notes that do not have an active market in which they can be traded. Once a bearer has decided to acquire that type of promissory it is difficult, if not impossible, for him to part with it and the bearer must wait for the promissory note to mature, or a willing issuer to repurchase it before maturity. A later post will explain how banks and other financial-market participants have gone around this constraint by securitizing non-marketable claims.
Maybe the most well-known non-marketable financial instrument, especially after the 2008 financial crisis, are mortgages. Mortgages are medium- to long-term promissory notes that are secured by residential or commercial real estate (home, apartment building, store, among others). The issuer promises to pay on a monthly basis some interest income and to repay the principal owed by the time of maturity. If the mortgagee (the issuer of the mortgage like a household who buys a house) defaults, the mortgagor (the bearer of the mortgage, a bank who funded the household) can foreclose on the property, that is, the mortgagor can take ownership of the property, evict the current resident, and sell the property to try to recover any unpaid interest income, fees and principal owed. Figure 18.25 shows that the percentage of outstanding home mortgages in foreclosure quadrupled in the late 2000s with 4.5 percent of outstanding home mortgages in the process of foreclosure compared to around 1 percent for 20 years prior to the Great Recession. Millions of households lost their home and had to find alternative housing methods. Although home foreclosures are back down today, evictions are not because renters are now facing threats of eviction following a rapid increase in rents after the financial crisis.
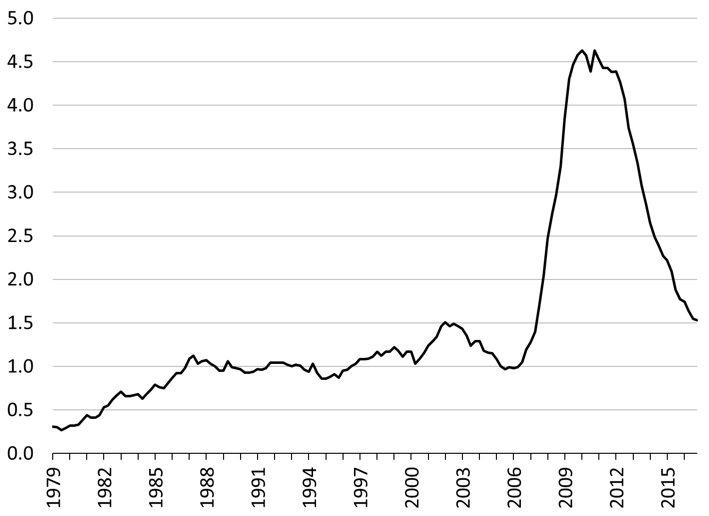
Figure 18.25 Percentage of residential home mortgages in the process of foreclosure, percent
Source: Mortgage Bankers Association (National Delinquency Survey)
Figure 18.27 shows that there are four main sectors that issue, or issued, mortgages. Households are the main issuer with 70 percent of outstanding mortgages issued by them in 2015, followed by nonfinancial noncorporate businesses (mostly small businesses) that issued 20 percent of outstanding mortgages. The rest of outstanding mortgages was issued by nonfinancial corporations, the federal government, and real estate investment trusts. The outstanding dollar amount of mortgages in 2015 was around $13 trillion and they are held by a wide variety of sectors (Figure 18.26). Until the 1970s, households, insurance companies and private depository institutions together held about 90 percent of all outstanding mortgages. After that, the rise of securitization led to a change in the structure of ownership of mortgages away from private depository institutions toward issuers of mortgage-backed securities. Private depository institutions continued to be the main initial bearer because households and small business companies goes to see them to fund the purchase of a house, a business, land or other real estate property. However, once private depository institutions have obtained the mortgage note, they may sell it to a government-sponsored enterprise or to special purpose entities (“Issuers of asset-backed securities”). Government-sponsored enterprise may themselves sell the mortgage to their own special purpose entities (“Agency- and GSE-backed mortgage pools”). As a consequence, the proportion of mortgages held by special purpose entities peaked to 45 percent right before the Great Recession. Following the Great Recession, GSEs bought back from their special purpose entities a large proportion of the mortgages so the proportion of mortgage held by GSEs went from 5 percent to 35 percent.
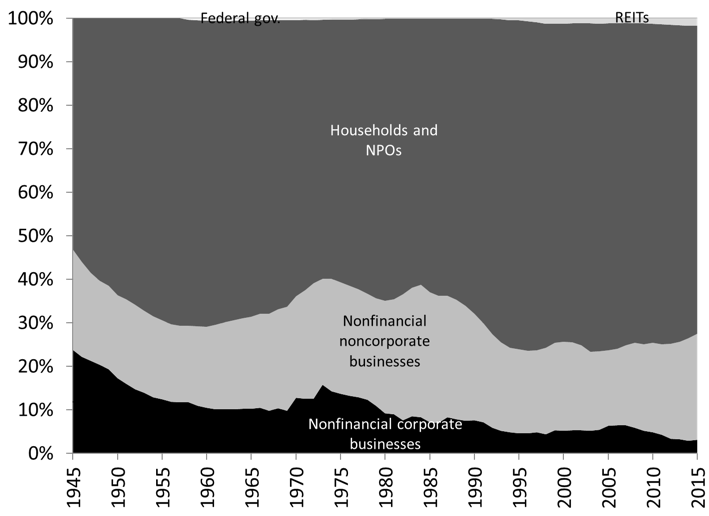
Figure 18.26 Structure of issuers of mortgages, percent.
Source: Board of Governors of the Federal Reserve System (series Z1, L.217)
Note: The federal government, via the Department of Defense, issued multi-family mortgages (that is mortgages backed by dwellings housing multiple families) between 1957 and 1965 to build housing for military families under the 1955 Capehart Housing Act.
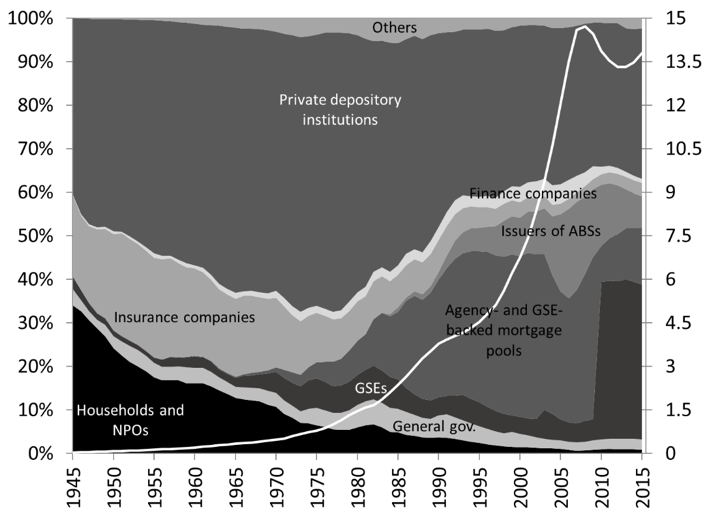
Figure 18.27. Structure of holders (percent) and level (trillions of dollars) of mortgages.
Source: Board of Governors of the Federal Reserve System (series Z1, L.217)
Mortgages deal with long-term financial needs to purchase expensive physical assets. Households also need funds for their daily expenses; to go to school, to buy food, to buy a car, among others. The category “consumer credit” regroups all sort of secured and unsecured promissory notes issued by households with short- to medium-term to maturity that are not marketable; credit card receivables, automobile debts, student debts, health care debts, among other debts (Figure 18.29). Some of these promissory notes, such as automobile debts, are secured (if a household defaults, the bearer of the note takes the car and resells it). All of them promise to pay interest and principal periodically and on time.
Figure 18.28 shows that the outstanding amount of consumer credit has grown rapidly since the early 1990s to reach $3.6 trillion in 2015. Until 1990, private depository institutions, finance companies and businesses were the main holders of consumer credit. In the 1990s, with the rise of securitization, private depository institutions sold some of their holdings to ABS issuers that held up to 20 percent of outstanding consumer credit prior to the 2008 financial crisis. After that private depository institutions repurchased from ABS issuers most of the consumer debts that they sold to them. The federal government, through student debt, also has come to hold a large and growing proportion of all consumer credit (25 percent in 2015).
Households and small businesses are not the only ones who issued non-marketable securities. The US Treasury is a major issuer of such promissory note. There are not marketable either because they are issued to a specific person and so are not transferable to another bearer (US savings bonds are issued to specific individuals and so the coupon and principal can only be paid to that individual), or are held for internal purpose within different agencies of the federal government. While US savings bonds (issued to households) used to be the main type of non-marketable Treasury securities, in 2015 there were $2 trillion of non-marketable Treasury securities and 90 percent of them were held by various federal government retirement funds (Figure 18.30).
Other non-marketable promissory notes are pensions owed by public and pension funds, pension entitlements, and insurance contracts. These types of promissory note are contingent, that is, they make payments to bearer when an event/contingency occurs (retirement, car crash, etc.). In exchange, bearers have to make a periodic payment to the issuer of these contracts (insurance premium, contributions to retirement accounts, etc.). Post 19 will study them more carefully. For example, the outstanding amount of pension entitlements (retirement savings plans such as investment retirement accounts and annuities) owed to households was about $21 trillion in 2015. While the federal government retirement funds used to be the main issuers of retirement savings plans with 60 percent of outstanding contracts, today that proportion has shrunk to 20 percent. State and local government pension funds and private providers of pension (pension funds and life insurance companies) are now the main issuer of retirement savings plans (Figure 18.31).
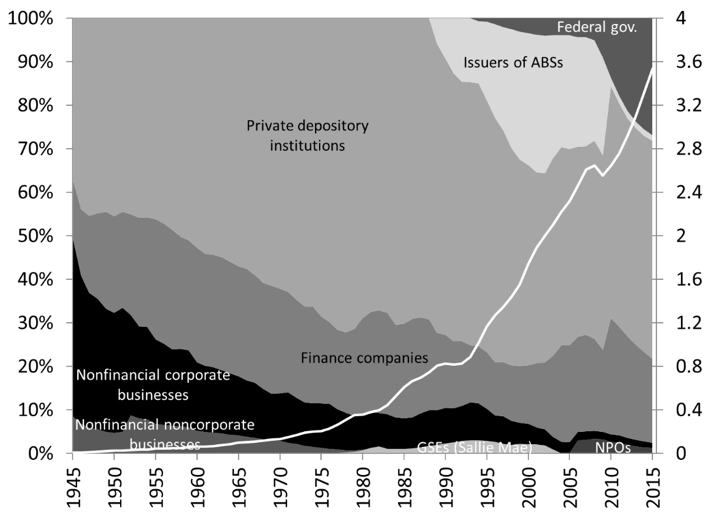
Figure 18.28. Structure of holders (percent) and level (trillions of dollars) of consumer credit.
Source: Board of Governors of the Federal Reserve System (series Z1, L.222)
Notes: Non-profit organization holdings represent student debt originated under the Federal Family Education Loan Program. Federal government holding includes debt originated by the Department of Education under the Federal Direct Loan Program and Perkins Loans, as well as Federal Family Education Loan Program, promissory notes that the government purchased from depository institutions, finance companies, and nonprofit and educational institutions, and promissory notes in default.
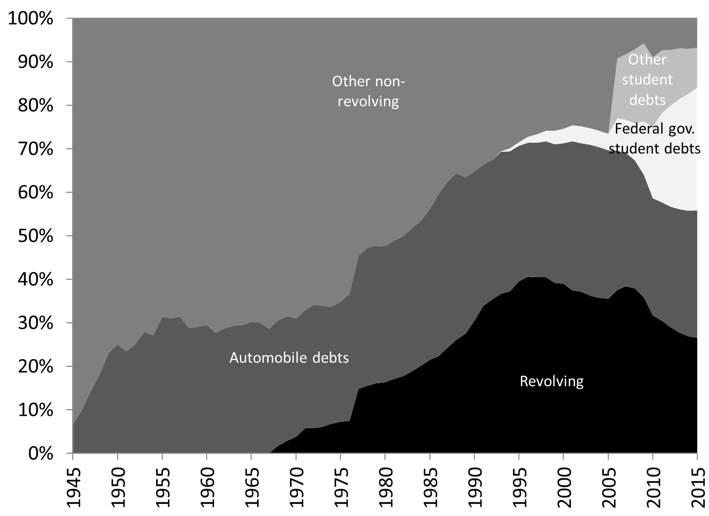
Figure 18.29. Types of consumer credit, percent.
Source: Board of Governors of the Federal Reserve System (series Z1, L.222)
Note: Revolving consumer credit includes mostly credit card debt but also other miscellaneous consumer credit such as overdraft plan on checking accounts (that is the ability to have a negative balance on a bank account that is renewed as long as it is repaid in due time). Home equity lines of credit are not included in revolving consumer credit, which are unsecured promissory notes, but are part of outstanding mortgages.
Note: Prior to Q1 2006, “other student debts” is included in non-revolving consumer credit
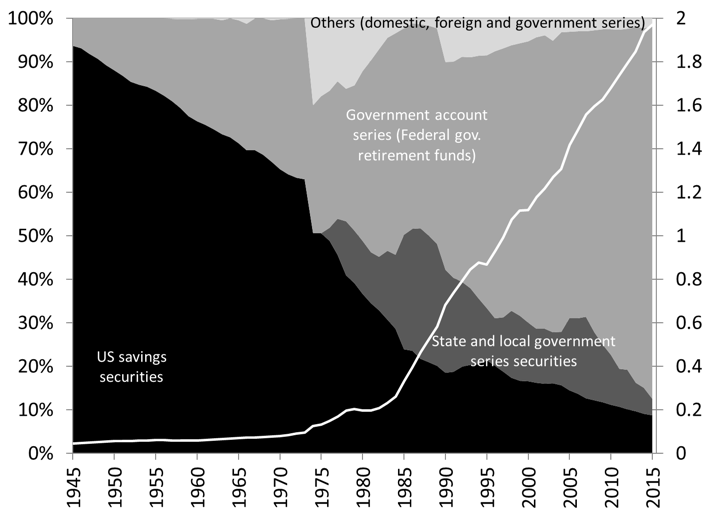
Figure 18.30. Type (percent) and outstanding dollar amount (trillions of dollars) of non-marketable treasuries.
Source: Board of Governors of the Federal Reserve System (series Z.1, part of L.210)

Figure 18.31 Structure of issuers (percent) and level (trillions of dollars) of pension entitlements.
Source: Board of Governors of the Federal Reserve System (series Z.1, L.227)
Note: Life insurance contracts consist in annuities, private pension funds contracts include unallocated insurance company contracts beginning 1985:Q4, federal government contracts includes the Thrift Savings Plan, the National Railroad Retirement Investment Trust, and other federal government retirement funds.
Conclusion
There is a very wide range of promissory notes issued in the United States that vary in terms of term to maturity, in terms of the type of income paid, in terms of the protection provided, among others. One may wonder why so many different types of promissory notes are issued. One of the reason is that issuers have different needs; a household does not need or want to fund its grocery shopping with a 30-year mortgage, and buying a house with a credit card, if possible, would be expensive and cumbersome. Another reason is that bearers are have different needs. Given the nature of their own liabilities (presented in Post 19), pension funds much prefer to hold long-term securities that are safe, while money market mutual funds prefer short-term securities. As such, the US Treasury, one of the main issuer of securities, actively managed the structure of Treasuries to accommodate the needs of bearers. For example, if bearers want more long-term treasuries, US Treasury will consider those needs when it issues new Treasuries.
Not everybody can issue marketable promissory notes because the financial, legal, and administrative requirements to meet are too high. For example, most individuals and small businesses do not need much more than a few hundreds of thousands of dollars—a few millions at best—to buy a house and other assets, which is not interesting to financial market participants that deal mostly with economic units who want to raise hundreds of millions, or billions, of dollars. Similarly, the earnings of households and small businesses are too small to provide an attractive income to financial market participants. Finally, to be able to issue bonds and keep them listed of an organized exchange (see Post 19), one must go through several costly and cumbersome steps such as releasing quarterly detailed accounting documents (balance sheets and others). Some celebrities, such as David Bowie, have been able to issue personal bonds (“Bowie bonds”) but they needed tens of millions of dollars ($55 million for David Bowie, a small issuance) and have earnings (such as music royalty revenue streams) that are large and stable enough to make payments due on the bonds.
The fact that there is such a wide variety of promissory note that can be issued in the United States make the financial sector highly flexible to deal with the financial needs of households, businesses and governments. This promotes economic activity and financial security as long as the issuance of promissory note is done properly, which is not always the case as explain in Post 14.
Finally, within a country, there is a hierarchy of promissory notes in the sense that some are more easily accepted. The most widely accepted promissory notes are those that are negotiable, of the highest creditworthiness, of the highest liquidity, and of the shortest term to maturity. In contemporary economies with a monetarily sovereign government, central-bank monetary instruments (Federal Reserve notes and checking accounts issued by the Federal Reserve) are at the top of the hierarchy. They are followed by bank monetary instruments (banknotes, if possible, and bank accounts). Below the previous monetary instruments are promissory notes traded on an organized exchange issued mostly by governments and corporations (shares, bonds, notes, bills, etc.). At the bottom of the hierarchy, there are all sorts of promises such as local currencies and personal non-marketable promissory notes. This hierarchy is not fixed and, throughout history, the top monetary instrument was not always a government monetary instrument. Figure 18.32 shows a classification of the domestic promissory note presented above from the most accepted (government monetary instruments) to the least accepted (non-marketable promissory notes). One may note in passing that Figure 18.32 assumes a monetarily sovereign, an issue of great importance as explained in Post 6 and Post 13.

Figure 18.32 Hierarchy of some promissory notes issued in the United States
Figure 18.33 shows the outstanding dollar amount and structure of all the promissory notes presented above together with a few others. Note that off-balance sheet derivate contracts (see later post) are not included although their outstanding value is around $700 trillion. There are also other debts that are not included such as special drawing rights, US-dollar denominated foreign account (Eurodollars), and other items in the Financial Accounts such as tax payables and trade payables. In 2015, there was about $160 trillion of outstanding financial instruments in the United States (all of them valued at book value except equity instruments that are valued at market price). In 2015, 12 percent of them were monetary instruments and close substitutes (categories 1 to 4) mostly time and savings accounts, another 15 percent were non-marketable promissory notes mostly mortgages (categories 5 to 8), 25 percent were debt securities (categories 10 to 14), 30 percent were equity securities (categories 15 to 18), 15 percent were contingent promissory notes (life insurance, pension, property insurance contracts) (Categories 19 to 21). The rest was trade credit that represented about 3 percent of outstanding promissory notes.
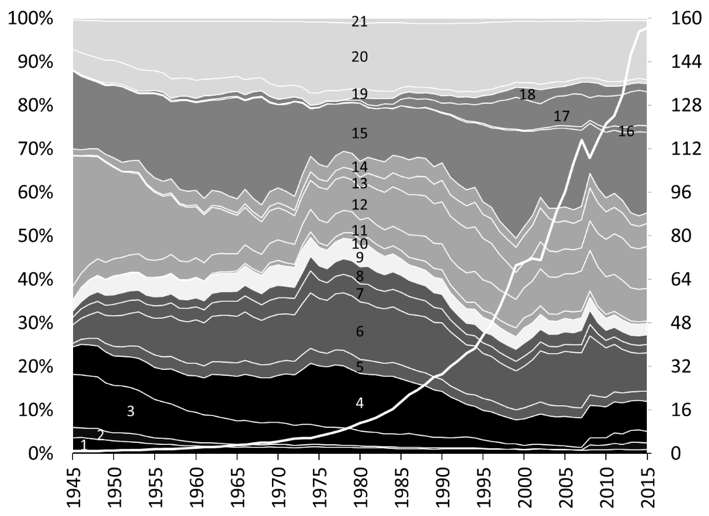

Figure 18.33. Structure (percent) and outstanding amount of most financial instruments included in the
Source: Board of Governors of the Federal Reserve System (series Z.1)
Note: Contrary to the Financial Accounts, category 2 includes checking accounts of private depository institutions (“reserve balances”). Following the Financial Accounts, currency in circulation means currency outside banks and the federal government plus vault cash. Life insurance reserves represents the discounted value of expected payments by life insurance.
That’s it for today! Next post studies the financial institutions involved in creating, pricing and holding all these promissory notes.


One response to “Money and Banking—Part 18 (B): Overview of the Financial System: A World of Promises”