
By Eric Tymoigne
Past posts have focused on the mechanics of a specific balance sheet, specifically that of the central bank and of private banks. This post looks at the balance-sheet interrelations between the three main macroeconomic sectors of an economy: the domestic private sector, the government sector and the foreign sector. This macro view provides some important insights about issues such as the public debt and deficit, policy goals that are more likely to be achieved, the business cycle, among others.
A primer on consolidation
The balance sheet of the domestic private sector puts together the balance sheets of all domestic private economic units. This means that claims that these sectors have on each other are removed from the balance sheet of the domestic private sector. For example, assume that the following two balance sheets exist


If they are consolidated we have as a first step:
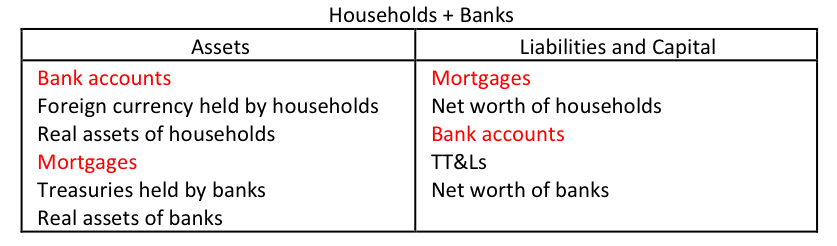
The terms in red appear on both sides of the balance sheet and are eliminated in the consolidation process so the balance sheet of households and banks is:

The only financial claims left are those issued to, and issued by, other sectors of the economy than households and banks. Thus, the consolidation process eliminates some important financial interlinkages. This is fine as long as one is merely interested in looking at relationship between sectors, but one should be mindful that this is a simplified picture that hides some important aspects of the economy.
The Three Sectors of the Economy
The analysis of financial interlinkages among the three main sectors can be done by starting from the National Income and Product Accounts (NIPA), but the derivation from the Financial Accounts of the United States is more intuitive (the derivation from NIPA is done at the end of this post). The following is refresher from post #1. A balance sheet is an accounting document that records what an economic unit owns (assets) and owes (liabilities) (Figure 1).

Figure 1. A Basic Balance Sheet.
Financial assets are claims issued by other economic units and real assets are things that have been produced. Financial liabilities are claims issued to other economic units. A balance sheet must balance, that is, the following equality must hold all the time: FA + RA ≡ FL + NW. Or put differently:
NW ≡ NFW + RA
This means that the wealth of any economic sector comes from two sources, net financial wealth (NFW = FA – FL) and real wealth (RA).
Each macroeconomic sector has a balance sheet (Figure 2). DP is the domestic private sector, G is the government sector, F is the foreign sector also called the “rest of the world.” The government sector includes all the levels of domestic government (local, state, federal) and the central bank. While the Financial Accounts of the United States include the balance sheet of the central bank in the domestic financial sector—the domestic financial sector includes domestic financial businesses and monetary authority—, it is convenient (for reasons explained in Post 6) to include the central bank in the government sector. The domestic private sector includes domestic households, domestic non-profit organizations, domestic financial businesses, domestic non-financial businesses, and domestic farms. The foreign sector includes anything else (foreign governments, foreign businesses, foreign households, etc.). Note that the adjective “domestic” is always used for the reference country that is studied. “Foreign” includes all other countries.

Figure 2. Balance sheets of macroeconomic sectors
For every creditor there is a debtor, so if one adds together the claims of the creditors and the debtors they must cancel out. For the world economy (all sectors consolidated together):
(FADP – FLDP) + (FAG – FLG) + (FAF – FLF) ≡ 0
This implies that the sum of all net worth equals the sum of all real assets, that is, only real assets are a source of wealth for the world economy (NW = RA):
(NWDP – RADP) + (NWG – RAG) + (NWF – RAF) ≡ 0
For a domestic economy (government and domestic private sectors are consolidated), there are two sources of wealth: real wealth and net financial wealth on the foreign sector. The public debt is not a source of financial wealth (or poverty) for the domestic economy because it is an asset for the domestic private sector but a debt of the domestic government. The domestic money supply is not a source of financial wealth for the domestic economy because it is an asset of a domestic holder and a liability of a domestic issuer.
Given that the previous identities hold in terms of levels (aka “stocks”), they also hold in terms of changes in levels (aka “flows”):
Δ(FADP – FLDP) + Δ(FAG – FLG) + Δ(FAF – FLF) ≡ 0
And, knowing that the Financial Accounts defines saving as a change in net worth (S = ΔNW) and investment as a change in real assets (I = ΔRA), it is also true that:
(SDP – IDP) + (SG – IG) + (SF – IF) ≡ 0
This last identity is similar to the NIPA identity (S – I) + (T – G) + CABF ≡ 0 (see below for some differences).
Given that NW – RA ≡ FA – FL, then (S – I) ≡ Δ(FA – FL). The operations on goods and services are mirrored by financial operations. (S – I) and Δ(FA – FL) are both officially called “net lending”, one measured from the capital account (S – I) and the other measured from the financial accounts Δ(FA – FL).
A few words on the way all this is sometimes presented by economists. Beware that economists may change the name of these two items. (S – I) may be called “net saving” (which is different from how the Financial Accounts define net saving) and Δ(FA – FL) may be called “net financial accumulation” (NFA). Thus, we have:
NFADP + NFAG + NFAF ≡ 0
If an economic sector accumulates more claims on other sectors than the other sectors accumulate claims on the economic sector in question, the economic sector records a positive net financial accumulation, it is a net creditor (aka “net lender”) during the period—Δ(FA – FL) > 0. If the opposite is true, the sector is a net debtor (aka “net borrower”) during the period. Finally, this identity is sometimes rewritten as:
DPB + GB + FB ≡ 0
With DPB the domestic private balance, FB the foreign balance (the opposite of the domestic current account balance), GB the government balance, and “balance” being measured either through the capital accounts (net saving) or through the financial accounts (net financial accumulation).
No theory, behavioral equations and causalities, was used above to explain the accounting identities (a bit of this is done below to examine the business cycle). The identities simply state that a net injection of funds by a sector must be accumulated in another sector. Every dollar must come from somewhere and must go somewhere.
Some important implications
They are many implications but the main one is that one must not study a sector in isolation. Anything that a sector does has an impact other sectors. When a forecast about the budgetary trend of the government is made, the forecaster must recognize the implications for other sectors to see if the forecast is realistic. This is usually not done. For example, the Congressional Budget Office in the early 2000s expected the federal government’s surplus to continue to grow but neglected to look at the implication in terms of the domestic private sector. A continuously rising government surplus implies continuously rising domestic private deficit given the foreign balance, which is not sustainable. Only the federal government of a monetarily sovereign government can sustain permanent deficits. There are many other implications and uses of this framework such as macroeconomic theory (Fullwiler), the madness of fiscal austerity (Rob Parenteau, Fullwiler), among others.
1. The beginning of the economy process requires that someone goes into debt.
Let us start with an economy in which nothing has been produced or acquired yet.

Figure 3 An economy at time 0
Say that someone in the economy wants to build a house that costs $10 to build. In order for domestic production to start, workers must be paid, raw material must be purchased (those had to be produced first by the way).
If a private business is in charge of doing all this, it must obtain funds and Post 10 explains how this is done. The balance sheet of the domestic private sector would look like this once the house is built:

Consolidation eliminates the debt owed by the homebuilder to a bank, as well as wages and raw material payments, because they are all internal to the sector. Once produced, if the house is acquired by a domestic household for $11, the following is recorded at the macro level:

Again all this hides quite a few underlying financial transactions:
- Households gets a mortgage and paid the homebuilder who make a $1 profit
- Firm repaid its $10 debt with interest
- House was transferred from firms’ balance sheet to household’s balance sheet.
The next period the process would start all over again. This time the firm may have some savings from the previous period to finance part of the production.
If, instead, the government buys the house, it must first fund the purchase by using a promissory note (FLG):

Spending by the government has allowed the domestic private sector to acquire a financial claim. It is a claim on the government.
If a foreign economic unit buys the house and the housebuilder requires payment in US dollar. There are several ways the procedure of payment can be done but all of them involves the foreign sector going into debt in dollars. For example:
- The foreigner may ask for a bank advance in US dollars at a domestic bank
- The foreigner may write a check in a foreign currency (says euros) but when the domestic bank of the housebuilder received the check, it will send the check back to the foreign bank of the buyer and to request a dollar payment. The foreign bank will need to borrow US dollars to settle its debt with the domestic bank.
Once the house is sold, the firm makes a $1 profit that is be used to pay interest, dividend and taxes. What is left over is retained earnings, the saving of the firm. Households will also save some funds. But none of that can occur unless someone goes into debt to start production. And for saving to be bigger, debt must increase.
2. Not all sectors can record a surplus at the same time.
It is quite straightforward to notice that not all sectors can be net creditors at the same time. At least one sector must be a net debtor if another sector is net creditor because for every creditor there must be a debtor. Most of the time, the domestic private sector is in surplus and the government sector is in deficit (Figures 1, 2a, 2b). New Zealand is a particularly odd case where the private sector is in deficit while government and foreign sectors are in surplus. To simplify, let us assume that NFAF = 0, therefore:
NFADP ≡ – NFAG
That is, for the private domestic sector (households and private companies) to be able to record a surplus (NFADP > 0), the government must run a fiscal deficit (NFAG < 0).
Put differently, when the government spends, it injects funds in the economy, and when it taxes it withdraws funds from the economy. If the government spends more than what it taxes, there is a net injection of funds by the government in the economy and this net injection must be accumulated somewhere. In the simple case, it is the private domestic sector that must accumulate the funds injected.
Of course, the reverse logic applies too. When the private sector deficit spends, it injects a net amount of funds into the economy that can only go to the government. This allows the government to run a surplus. A powerful consequence of this simple accounting rule is that a policy that aims at achieving government surplus implies, in a closed economy, that this policy aims at achieving a domestic private sector deficit.
One way to avoid this is to try to achieve a domestic current account surplus, in which case, a country can achieve domestic surpluses across the board—let us call that the “golden” state. The yellow area on Figure 2a shows how small the golden state is relative to all other possibilities. Among OECD countries, it has been achieved mainly by northern European countries (Figures 2a, 2b).
This state is difficult to achieve because a domestic current account surplus means that the foreign sector records a current account deficit (FB < 0). Again, not all sectors can be in surplus at the same time, and for every net exporter (and/or net foreign income earners) there must be a net importer (and/or net foreign income payer). Thus, for a domestic economy to achieve the golden state on a regular basis, there must be at least one foreign country that is willing to deficit spend vis-à-vis the domestic economy. This is hardly possible given that countries strive to reach current account surplus most of the time.
More importantly, the golden state is not achievable at the world level. If all economies try to achieve a current account surplus, the best they can achieve is a balanced current account (FB = 0), which brings us back to the identity:
NFADP ≡ – NFAG
Ultimately policy makers should confine themselves to try to manage what goes on in their domestic economy. If a country is lucky, developments in the rest of the world may ultimately allow that country to reach the golden state; but basing policy choices on the goal of reaching the golden state is a very long shot. In addition, policies that aim at achieving the golden state limit the ability of domestic sectors to deficit spend, which constrains the ability of the domestic economy to grow. Indeed, the goal becomes to constraint domestic spending by curtailing wage growth, by curtailing government spending and by raising taxes. This keeps costs down (and so keeps the price of exports low to attract foreign buyers) and limits imports (a growing domestic spending usually requires more imports and so makes it difficult to reach a domestic current account surplus).
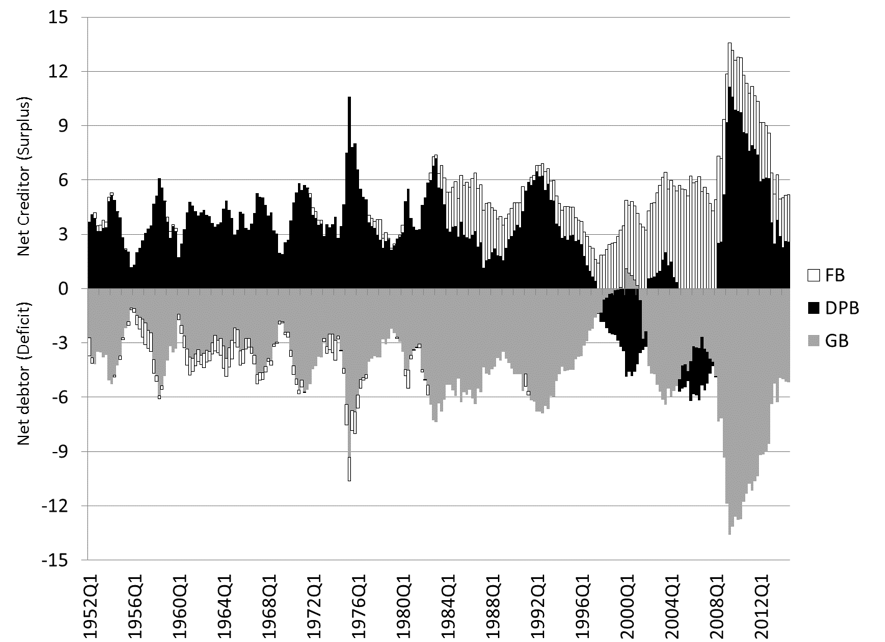
Figure 1. Net financial accumulation of the three major economic sectors in the United States, percent of GDP.
Source: Federal Reserve
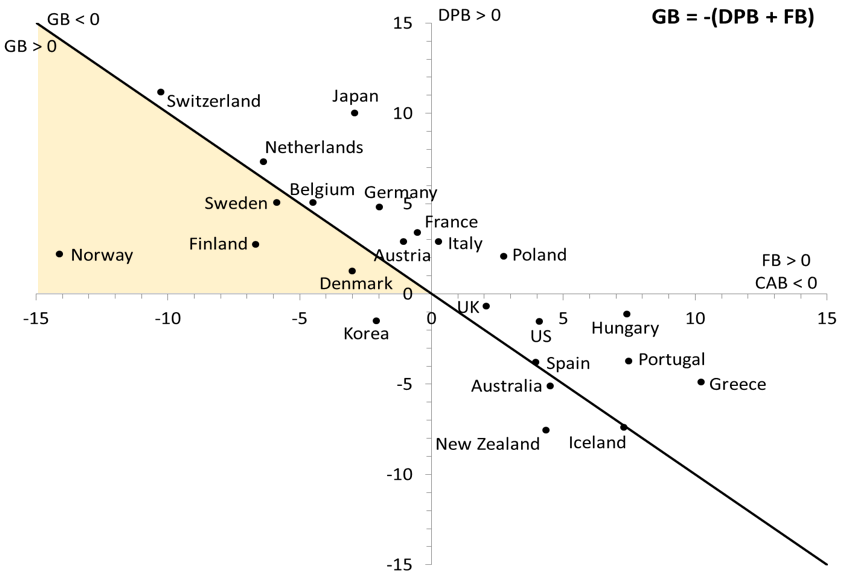
Figure 2a. Sectoral balances, an international perspective, 2000-2005 average, Percent of GDP
Source: OECD
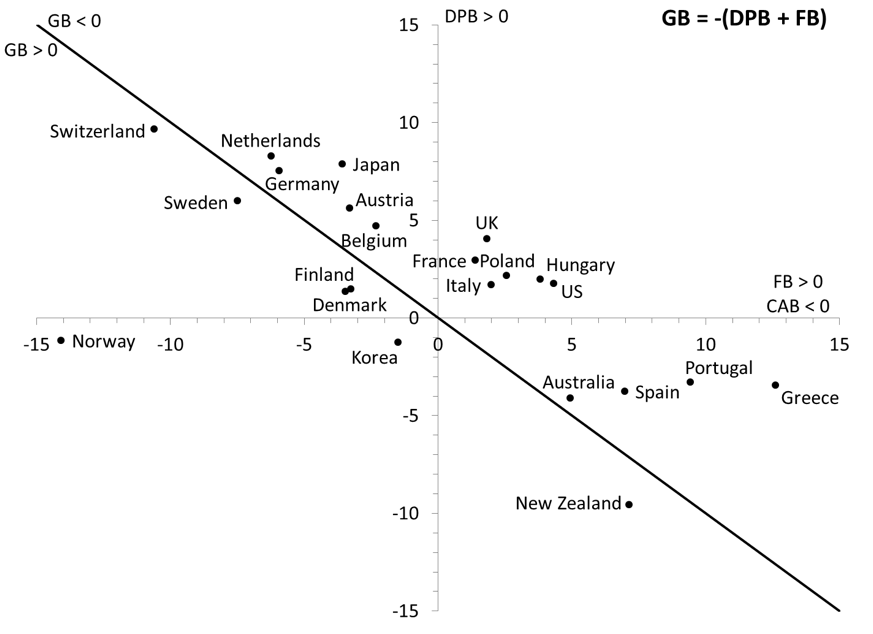
Figure 2b. Same with 2005-2010 averages.
3. Public debt and domestic private net wealth
The public debt is the outstanding U.S. Treasury securities (USTS). It includes both marketable (T-bills, T-notes, T-bonds, TIPSs, and a few others) and non-marketable securities (United States notes, Gold certificates, U.S. savings bonds, Treasury demand deposits issued to States and Local Gov., all sorts of government account series securities held by Deposit Funds).
In the early 2000s, the expectation of the day was that fiscal surpluses would continue to go on and rise even more. Figure 3 shows the projected path of the public debt and the monetary base. What are the implications of such trend of the public debt?
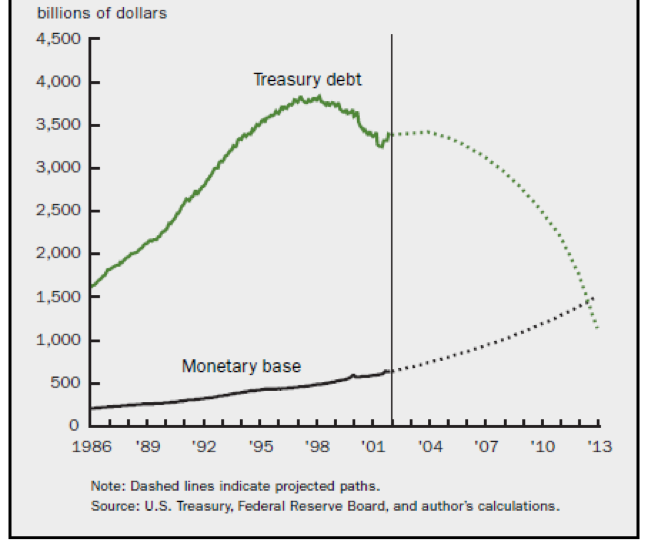
Figure 3 Public debt and monetary base.
Source: Marshall 2002
To simply the analysis, assume that: 1- the government sector only includes the federal Treasury and the central bank 2- at the moment the only liability of the government is treasuries (no central bank liability is outstanding) 3- a closed economy (no foreign sector) 4- the following balance sheets prevail:


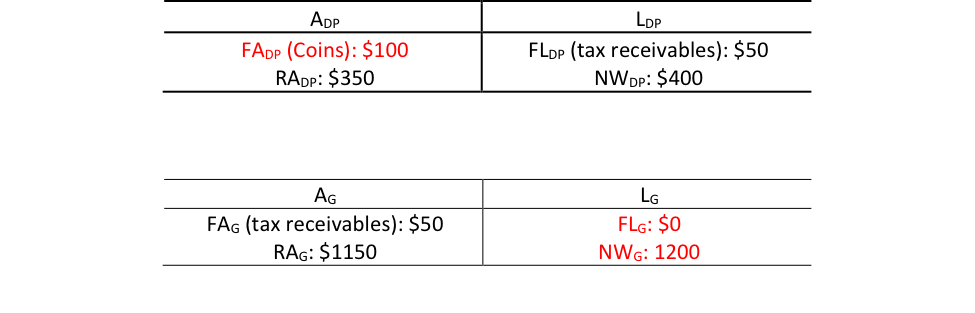
Now the Treasury wants to eliminate all its financial liabilities: no more public debt! What are the means to do so?
- Case 1: Let treasuries mature and do not repay holders of treasuries: 100% tax on principal => FADP = 0, the domestic private sector losses all its financial assets.

- Case 2: Switch to a Treasury’s financial instrument not considered a liability (Coins are treated as equity by the Federal Accounting Standards Advisory Board):
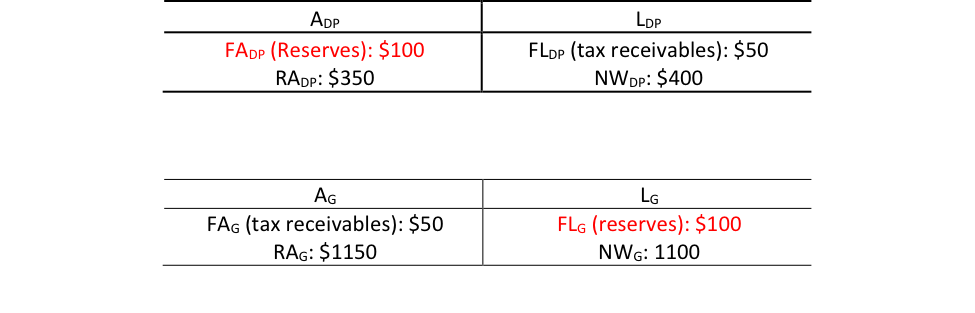
- Case 3: Switch to another liability of the government that is not included in the public debt: repay with Federal Reserve’s liabilities:
All these cases are detrimental to the domestic private sector because they remove a default-free, liquid, interest earning security from the balance sheet—treasuries. Treasuries are essential, to create wealth in the domestic private sector, to meet capital requirements, to earn interest income in a safe way, and to access to refinancing channels of the central bank. So be careful what you wish for when arguing for repaying the public debt.
4. Business cycle and sectoral balances
One can get a partial understanding of the business cycles just by looking the interactions between the three balances. First, one may note that usually all three sectors wish to be in surplus:
- Domestic private sector needs to record a surplus to avoid bankruptcy
- State and local governments need to record a surplus to avoid bankruptcy
- Federal government
- strives to be in surplus to show that government is fiscally responsible like other domestic sectors
- tends toward a surplus during an expansion because of the automatic stabilizers.
- Foreign sector: Political and financial stability reasons to reach a surplus
Of course it is not actually possible for all of them to be in surplus at the same time, but all of them usually want to be in a surplus at the same time.
Start with a situation where the non-government sector (NG is the consolidation of DP and F) is at the surplus it desires (NGBd):
- Step 1: there is a growing economy with NGB = NGBd > 0: Non-government sector net saves what it desires. In that case it must be true that GB < 0, the government is in deficit.
- Step 2: Government wants to be in surplus (GBd > 0). In a growing economy, automatic stabilizers lower the deficit of the government, which is what the government wants. But, if the government is dissatisfied with the pace of return toward a surplus, it may implement austerity policies that raise taxes (T) and/or lower spending (G) (“the country must live within its means”), which compounds the effect of automatic stabilizers. Thus ∆GB > 0 and so ∆NGB < 0.
- Step 3: NGB < NGBd so the non-government sector tries to find ways to increase its net financial accumulation:
- If DPB < DPBd : consumption and investment decline
- If FB < FBd: Domestic exports decline (i.e. foreign imports decline)
- Step 4: Decline in non-government spending (C, I, X), together with the decline in government spending (G), lead to a decline in aggregate income (GDP = C + I + G + NX). The decline in aggregate income leads to an automatic rise in G and an automatic decline in T, so the government balance falls (∆GB < 0). Income stabilizes.
- Step 5: the fall in the government balance leads to a rise of the non-government balance (∆NGB > 0) until NGB = NGBd. Back to step 1.
The only two ways to get a short-term stationary state (i.e. a situation where the level of aggregate income does not change) is:
- Way 1: For GBd to be negative, i.e. the government is willing to be in deficit, and the deficit equals the equilibrium deficit level (GB*). The equilibrium deficit level is the one compatible with the desired net saving of the non-government sector: GB* = NGBd. This is a viable solution for a monetarily sovereign government, but politicians are reluctant to argue for a permanent fiscal deficit given the lack of understanding of how a monetary sovereign government operates by the general population, politicians and most economists. Bankruptcy, accelerating inflation, and bond vigilantes are usually invoked, although none of them are relevant.
- Way 2: For NGBd to be negative:
- DPBd negative: this did happen in the late 1990s and early 2000s in the United States (Figure 1), which made GB > 0 possible. Australia, Korea, New Zealand and some European countries also have recorded a negative domestic private balance (Figure 2a, 2b). However, domestic private sector in deficit is not sustainable because it implies ultimately Ponzi finance (see Post 14).
- FBd negative (desired negative current account balance by foreigners so domestic current account is positive and large enough to fulfill the desired net saving of the government and domestic private sector): A negative FB can be tolerated for a foreign sector if it is a developing country, or if the foreign country understands the need to provide the international reserve currency to satisfy the needs of the rest of the world. However:
- If a country needs to deficit spend vis-a-vis the rest of the world, it means that either the domestic private sector or the government do so, or both. If the domestic private sector does it, it is unstable, if the government does it, it depends on the denomination of the debt (if in domestic currency no problem).
- For the country supplying the international reserve currency, negative domestic CAB is sustainable only if the currency in unconvertible. If the currency is convertible then the Triffin dilemma holds. The dilemma is that the country must have a deficit of its current account balance in order to supply the currency that the rest of the world needs, but the country faces threats of conversion demands as the supply of reserve currency grows among other countries.
Conclusion
The macroeconomic sectoral balance identity shows that some desires are not compatible or extremely hard to achieve. As such, regardless of the amount of economic adjustments—devaluation, change in interest rate, aggregate income fluctuation, etc.—some desires can never be achieved and it is highly destructive to continue policies that aim at achieving incompatible desires. It is best to set policy goals and desires that are compatible with accounting rules and to be aware that:
- One’s surplus is someone else’s deficit
- One’s saving is someone else’s dissaving
- One’s export is someone else’s import
- One’s spending is someone else’s income
- One’s financial asset is someone else’s debt
- One’s credit is someone else’s debit
Accounting rules can be combined with insights from the way monetary systems work to draw some important conclusions:
- Private domestic sector should avoid being a net debtor: leads to financial instability (see Post 14)
- A monetarily sovereign federal government usually needs to be in deficit (unless a domestic current account balance can be achieved): such government is always able to service debts denominated in its unit of account.
- Some economies need to be net importers:
- If they have limited economic development and resources. In that case foreign aid instead of private lending is the way to go.
- If they provide the international currency (United States today). In that case, the rest of the world wants to net save that currency and so the currency-issuing country must record a current account deficit.
- Given that some countries need to be net importers, others need to be net exporters: there may be a need to clear debt overtime if it accumulates too fast, and to set the interest rate low relative to growth.
To go further: Sector balances from the perspective of the National Income and Product Accounts
At the aggregate level, the National Income and Product Accounts (NIPA) managed by the Bureau of Economic Analysis records all economic operations on goods and services. NIPA shows us that the expenditure approach to gross domestic product (GDP) holds as a matter of accounting:
GDP ≡ C + I + G + NX
The gross domestic product is the sum of all final expenditures on goods and services, including domestic private final consumption (C), domestic private investment (I), government spending on goods and services (G), and net exports (NX). We also know that the income approach to GDP holds as a matter of accounting:
GDP ≡ YD + T
That is, with minor discrepancies, the gross domestic product is the sum of all gross incomes, or, stated alternatively, the sum of all domestic disposable incomes (YD)—wages, profits, interest and rent—and the amount of overall taxes (net of transfers) on income and production (T). This means that:
YD + T ≡ C + I + G + NX
We also know that, when accounting for international income sources, the U.S. International Transactions Accounts (USITA) (that accounts for the relation between the United States and the rest of the world) tells us that:
CABUS ≡ NX + NRA
The current account balance (CAB) is the sum of the trade balance (net exports) and net revenue from abroad (NRA) (net of unilateral current transfers).
If one combines the NIPA and USITA and now includes in T the taxes earned on foreign income (NRAD is disposable net revenues from abroad) we get the following:
YD + NRAD + T ≡ C + I + G + CABUS
We also know that, in the NIPA, aggregate saving (S) is defined as the difference between disposable income and consumption, S ≡ YD + NRAD – C, therefore:
(S – I) + (T – G) – CABUS ≡ 0
Or, given that for every net exporter there is a net importer (CABF = -CABUS):
(S – I) + (T – G) + CABF ≡ 0
This last identity is similar to the one obtained from the Financial Accounts except that it is derived from GDP and so is merely concerns with current output (i.e. newly produced goods and services).
To go even further: NIPA and FA definition of saving
The National Income and Product Accounts (NIPA) definition of saving is different from that of Financial Accounts (FA) and they are compatible only under specific conditions. NIPA saving is defined as unconsumed income. For example, households saving is defined as disposable income minus spending on consumption goods: S = YD – C. FA saving is defined as the increase in net wealth: S = ΔNW.
This difference reflects the different purpose of each account. NIPA is focused on measuring current economic activity with gross domestic product (GDP) at the core of the analysis. So for example, say that an economy produces apples and some of the apples are used to make apple tarts. GDP will be the dollar value of apples left for direct consumption and the dollar value of apple tarts. This is the production for the year. NIPA saving is the value of whatever income was paid less purchases of apple tarts and apples for direct consumption.
FA is broader in its perspective given that it aims at measuring what goes on in balance sheets. Balance sheets are impacted by many more things than just current production because, among others:
- They contain real assets that were previously produced
- They contain financial assets
- The dollar value of assets changes overtime because of changes in prices (capital gains/losses) instead of addition to the stock of assets via production or issuance of new securities.
- Some consumption goods are durable.
- Liabilities in the balance sheets require principal repayment.
For example, say that a household owns nothing and owes nothing. The household starts to work and gets paid $10 so its balance sheet is now:

Saving is equal to $10 according to FA because net wealth increased by $10, and here NIPA would also agree given that nothing has been consumed. Now the household goes to the store and buys $2 worth of apples and that is the only spending for the month:

According to NIPA, saving is $8 whereas it is still $10 for FA. Once the household eats the apples, the definitions give the same value again:

The source of difference in this case is that NIPA measures consumption by the amount of spending done for that purpose (buying the apple at the store). Consumption in a balance sheet means that the value of real asset falls (the apples have been eaten). Recently the Bureau of Economic Analysis created the Integrated Macroeconomic Accounts that aim at integrating the two approaches into one single accounting framework.
Kenneth Boulding developed an entire framework based on definitions consistent with balance sheet. A clear difference is made between “spending” (using funds to buy the apples: real assets go up and financial assets fall) and “consuming” (eating the apples: real assets depreciate). Developments in economic theory have also aimed at making sure that the accounting of a model is tight. Stock-flow consistency macroeconomic modeling ensures that a model accounts for all the interdependences between the sectors that the model contains.
Done for today! Next topic is “financial crisis” followed by the last topic, “Money.”
[Revised 8/6/2016]


11 responses to “Money and Banking Part 13: Balance Sheet Interrelations and the Macroeconomy”