
In previous blogs we have examined the three balances identity and established that the sum of deficits and surpluses across the three sectors (domestic private, government, and foreign) must be zero. We have also attempted to say something about causation because it is not enough to simply lay out identities. We have argued that while household income largely determines spending at the individual level, at the level of the economy as a whole it is best to reverse that causation: spending determines income.
Individual households can certainly decide to spend less in order to save more. But if all households were to try to spend less, this would reduce aggregate consumption and thus national income. Firms would reduce output, thus, would lay-off workers, cut the wage bill, and thereby lower household income. This is Keynes’s well-known “paradox of thrift”—trying to save more by cutting consumption will not increase saving. We’ll have more to say about that in later MMP blogs.
However there is an issue of immediate interest given the deficit hysteria that has gripped the United States (as well as many other countries). In the aftermath of the global financial crisis (GFC) social spending by government (for example, on unemployment compensations) has risen while tax revenues have collapsed. The deficit has grown rapidly leading to widespread fears of eventual insolvency or bankruptcy. Those, too, are issues for later blogs. The implication of growing deficits has been attempts to cut spending (and perhaps to increase taxes) to reduce deficits. The national conversation (in the US, the UK, and Greece, for example) presumes that government budget deficits are discretionary. If only the government were to try hard enough, it could slash its deficit.
As I have argued in previous blogs (particularly in responses to questions), however, anyone who proposes to cut government deficits must be prepared to project impacts on the other balances (private and foreign) because by identity the budget deficit cannot be reduced unless the private sector surplus or the foreign surplus (flip side to the domestic current account deficit) is reduced. In this blog, let us look at the rise of the US government budget deficit since the GFC hit. We will ask whether the deficit has been, and might be, under discretionary control—if not then that raises questions about the attempts by deficit hysterians to reduce deficits.
In the aftermath of the Great Recession of 2007, the US federal government budget moved sharply to large deficits. While many attributed this to various fiscal stimulus packages (including bail-outs of the auto industry and Wall Street), the largest portion of the increase in the deficit came from automatic stabilizers and not from discretionary spending. This is easily observable in the graph below which shows the rate of growth of tax revenues (mostly automatic), government consumption expenditures (somewhat discretionary) and transfer payments (again mostly automatic) relative to the same quarter of the previous year:
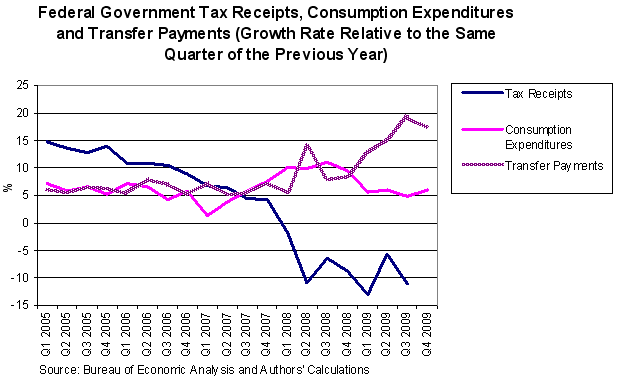
In 2005 tax revenues were humming, with a growth rate hitting 15% per year—far above GDP growth–hence, reducing non-government sector income—and faster than government spending, which grew just above 5%. Such fiscal tightening (called fiscal drag) often is followed by a downturn—and the downturn that accompanied the GFC was no exception. When it came, the budget deficits increased, mostly automatically. While government consumption expenditures remained relatively stable over the downturn (after a short spike in 2007-2008), the rate of growth of tax revenues dropped sharply from a 5% growth rate to a 10% negative growth rate over just three quarters (from Q 4 of 2007 to Q 2 of 2008), reaching another low of -15% in Q1 of 2009. Tax receipts quite simply fell off a cliff.
Transfer payments grew at an average rate of 10% since 2007, with the higher rate in part due to the rotten economy. Decreasing taxes coupled with increased transfer payments automatically pushed the budget into a larger deficit, notwithstanding the flat consumption expenditures. The automatic stabilizer–and not the bailouts or stimulus—is the main reason why the economy did not go into a freefall as it had in the Great Depression of the 1930s. As the economy slowed, the budget automatically went into a deficit putting a floor on aggregate demand. With countercyclical spending and pro-cyclical taxes, the government’s budget acts as a powerful automatic stabilizer: deficits increase sharply in a downturn.
The expansion before the GFC had been led (mostly) by the 2000s housing boom, during which households borrowed (and spent) on an unprecedented scale. We already visited the three balances that demonstrated the private sector taken as a whole deficit spent for almost a decade in the lead-up to the GFC. In the Clinton boom, about half the deficit spending was by firms; however in the 2000s boom it was entirely the household sector that spent more than its income. Both the Clinton boom and the 2000s boom caused the budget deficit to fall (and to actually move into a large surplus during the Clinton years).
Since the crash, the household sector has retrenched (as it always does in recession), and saving remains high. Slow growth has been the major cause of the rapidly growing budget deficit—and the slow growth, in turn, is due to a high propensity to save by the retrenching household sector. See the next graph (thanks to Dimitri Papadimitriou of the Levy Economics Institute for providing the next two graphs to me):
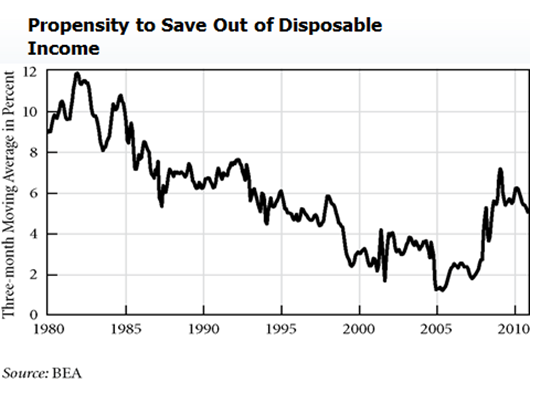
What we see is a rather remarkable reduction of household saving on trend since the mid-1980s. The cause is beyond the scope of this blog. But the flip-side to that has been the rise of household debt. That trend turned around sharply after the GFC, with households saving like it was 1992 all over again. Given loss of jobs, and stagnant incomes (at best) for most Americans, the notion that the household propensity to spend will sharply reverse course seems unlikely.
As we discussed above, shrinking the government’s deficit will require either that the private sector spend more relative to its income or that the US current account deficit fall sharply. But households are still heavily indebted and indeed more and more homeowners are falling “underwater”—so the likelihood that they will drop saving back down to the 2-3% range we saw in the 2000s seems unlikely. (Note that saving as a percent of disposable income is not exactly the same as the household balance that goes into our three sector balance equation. That is why although this is a small positive saving number, in the sectoral balances equation households actually spent more than their income. See the note at the end of this blog for the wonky stuff.)
Another possibility is a domestic private business sector boom. That, too is unlikely with high unemployment and depressed domestic demand and stagnant sales—investment by firms is not going to grow that much. (I won’t go into it here, but there is a lot of evidence that “investment-led booms” are really residential housing investment booms—housing construction is included in investment numbers–and there is little chance that we will see a housing construction boom in the near future.)
The final possibility is the foreign sector. The next graph shows US imports and exports on current account.

Imports are running around 18% of GDP (rebounding sharply since the GFC) and exports are at 14% of GDP—so exports are up, but imports are climbing a bit faster (this difference is mostly due to oil). While it is true that the US current account balance has become less negative in recent months, much more movement will be required to actually get to positive territory (more than 3% of GDP of adjustment would be required). Note that the last time we actually had a positive current account balance was in the Bush, Sr., recession—two decades ago.
Remember, to reduce the government sector deficit from the current 9% or so of GDP toward balance will require some combination of a private sector movement toward deficit and a current account movement toward surplus amounting to a total of 9% points of GDP. That is huge. The problem is that actually trying to balance the budget through spending cuts or tax increases could reduce economic growth (I think it will actually cause a sharp downturn, but I do not need to make that case). Lower economic growth could conceivably reduce our current account deficit—by making Americans too poor to buy imports, by lowering US wages and prices to make our exports more competitive, and by reducing the value of the dollar. Note that all of those are painful adjustments for Americans. And it might not work, because it requires the US to slow without that affecting the global economy—if it also slows, US exports will not increase.
Now, deficit warriors insist that cutting government will induce faster growth of the private sector. If that were true, it actually makes it easier to reduce the budget deficit—as the private sector’s balance worsens toward deficit. On the other hand, more rapid growth will probably cause deterioration of the current account deficit (our imports will rise; our wages and prices will not fall; and the dollar could gain strength). That in turn must be matched by some combination of private sector and government sector movements toward deficits. The US has a higher propensity to import than do our trading partners—what that means is that if we grow at about the same rate as the rest of the world, our imports grow faster than our exports.
So, to balance the government’s budget we need to grow faster, but faster growth will probably increase our current account deficit so that the three balances identity will imply either that our private sector returns to excessive spending (as it did for the past decade) or that the government’s deficit cannot be reduced. It is something of a Hobson’s choice—with no morality implied—because what appears to be a “free choice” of reducing the budget deficit through faster growth means we actually are accepting bigger household debts and a bigger current account deficit.
That is the problem with analysis and policy recommendations that do not take account of the three balances—they ignore what is implied for the other balances.
Let us summarize the points. First, the three balances must balance to zero. This implies it is impossible to change one of the balances without having a change in at least one other. Second, at the aggregate level, spending (mostly) determines income. A sector can spend more than its income, but that means another spends less. While we can take government spending as more-or-less discretionary, government tax revenue (its equivalent to its income) depends largely on economic performance. Chart 1 above showed that tax receipt growth is highly variable, moving pro-cyclically (growing rapidly in boom and collapsing in slump).
Government can always decide to spend more (yes, it is politically constrained), and it can always decide to raise tax rates (again, given political constraints), but it cannot decide what its tax revenue will be because we apply a tax rate to variables like income and wealth that are outside government control. And that means the budgetary outcome—whether surplus, balanced, or deficit—is not really discretionary.
Turning to our foreign sector, exports are largely outside control of the US (we say they are “exogenous” or “autonomous to US income”). They depend on lots of factors, including growth in the rest of the world, US exchange rates, trade policy, and relative prices and wages (US efforts to increase exports will almost certainly lead to responses abroad). It is true that economic outcomes in the US can influence exports (as discussed, slower US growth can slow global growth)—but impacts of policy on exports are loose.
On the other hand, US imports depend largely on US income (plus exchange rates, relative wages and prices, and trade policy; again, if the US tried to reduce imports this would almost certainly lead to responses by trading partners that are pursuing trade-led growth). Imports are largely pro-cyclical, too. Again, our current account outcome—whether deficit, surplus, or balanced—is also largely nondiscretionary.
What is discretionary? Domestic spending—by households, firms, and government—is largely discretionary. And spending largely determines our income. Sectoral balances, however, should be taken as mostly nondiscretionary because they depend in very complex ways on the discretionary variables plus the nondiscretionary variables and on the constraints imposed by the macro identity. It makes most sense to promote spending that will utilize domestic resources close to capacity, and then let sectoral balances fall where they may. As we will argue in coming months, the best domestic policy is to pursue full employment and price stability—not to target arbitrary government deficit or debt limits, which are mostly nondiscretionary, anyway.
Note 1: The main differences between the personal saving rate and the household net saving as a % of GDP are the following (thanks to Scott Fullwiler):
- Household net saving is as a % of GDP, whereas personal saving rate is as a % of disposable income
- Household net saving subtracts all household spending, including consumption and residential investment, whereas personal saving only subtracts consumption spending
A few additional smaller differences for the really wonky:
- Household net saving adds an allowance for household capital consumption (i.e., depreciation), personal saving doesn’t,
- Household net saving imputes insurance and pension reserves to households from govt sector, personal saving doesn’t, and
- Household net saving includes wage accruals less disbursements from businesses to households, personal saving doesn’t.
Note 2: Thanks to the MMT gang. You know who you are.


17 responses to “Government Budget Deficits are Largely Nondiscretionary: the Case of the Great Recession of 2007”