
Lately, I’ve had the feeling that “progressive” journalists and commentators too often pull their punches in calling attention to social problems, by underestimating the magnitude of problem-related statistics such as the unemployment rate and the number of fatalities due to lack of health insurance in the United States. My theory about this is that “progressives” are being defensive in their approach and bending over backwards to give the right wing the benefit of the doubt by understating numbers out of an abundance of caution.
If this is right, then my reply is that underestimating problem-related numbers is just as bad as over-estimating them, and that what people ought to do is try to provide the best estimates they can and let the critical chips from the right fall where they may. In this post, I want to raise a question about the accuracy of the numerical estimates of US deaths due to lack of health insurance often seen in articles and blogs authored by people, like myself, who favor eliminating insurance coverage shortfalls by passing Medicare for All.
The Woolhandler/Harvard Study and Its headline Finding
When progressives write about the number of deaths associated with lack of health insurance they, almost invariably, directly cite or project from the headline finding of an analysis of data, gathered by the Third National Health and Nutrition Examination Survey (NHANES III), done at the Harvard Medical School whose results were published in the American Journal of Public Health in December of 2009, with pre-publication prints appearing at least as early as September of 2009. The peer-reviewed article reporting the results of the study directed by Steffie Woolhandler, was co-authored by Andrew P. Wilper, MD, MPH, Steffie Woolhandler, MD, MPH, Karen E. Lasser, MD, MPH, but pre-publication Danny McCormick, MD, MPH, David H. Bor, MD,and David U. Himmelstein, MD.
The NHANES III survey data was gathered over the period 1988 – 1994, and followup interviews were then conducted in the year 2000. The Harvard researchers analyzed the data using a Cox Regression proportional hazards model, a method widely used in medical research and epidemiology. They calculated “hazard ratios” from the data using this modeling and analysis method and then went on to calculate propensity scores, and finally used those to estimate fatalities among the uninsured using Census data.
The article reporting their study was frequently cited in the run-up to passage of the Affordable Care Act (ACA) in the Fall of 2009 – 2010, and its headline conclusion has been cited ever since in articles and blog posts much too numerous to cite. The headline conclusion, as normally stated is that there are 44,789 or sometimes approximately 45,000 fatalities annually associated with, or more boldly, caused, by lack of health insurance.
In the Wilper et al article however, the headline finding stated is (p. 2292):
Replicating the methods of the IOM panel with updated census data and this hazard ratio, we calculated 27424 deaths among Americans aged 25 to 64 years in 2000 associated with lack of health insurance. Applying this hazard ratio to census data from 2005 and including all persons aged 18 to 64 years yields an estimated 35327 deaths annually among the non-elderly associated with lack of health insurance. When we repeated this approach without age stratification, (thought by investigators at the Urban Institute to be an overly conservative approach) we calculated approximately 44789 deaths among Americans aged 18 to 64 years in 2005 associated with lack of health insurance.
IOM in the above quote is the Institute of Medicine of the National Academy of Sciences, and the citations in the above passage are to Centers for Disease Control and Prevention, National Center for Health Statistics, Census Bureau, and Urban Institute Reports. Note that the number of deaths estimate applies to the population 18 – 64 years for the year 2005. There’s no claim in the above quote that the same estimate would apply to the years since that time or to the whole population under 65. But on p. 2294, in the conclusions section, the authors say:
Lack of health insurance is associated with as many as 44789 deaths per year in the United States, . . .
This is clearly an overdrawn conclusion since it’s dependent on the 1) estimated hazard ratio remaining constant, 2) estimated base populations of both insured and uninsured remaining the same when these are changing every year, and 3) extent to which the various limitations they mention on pp. 2293 – 2294 of their article lead to an underestimate of the hazard associated with being uninsured. The likelihood of these limitations leading to an underestimate of deaths in their study is very great, as the authors themselves say.
So, given this, why say: “. . . as many as 44789 deaths . . . “ above. Why not say “. . . . at least 44,789 deaths in 2005 and most likely substantially more than that . .. “? And why not also point out that since in the years after 2005 the number of uninsured has increased compared to 2005, and that the deaths have also increased, even assuming that the hazard ratio has remained the same, and hasn’t gotten worse?
A Question About the Study
But beyond this, the article by the Harvard researchers raises a question suggesting that the inference made by most readers about the study’s headline finding of approximately 45,000 fatalities annually in 2005 and the years following is a substantial underestimate of the number of annual fatalities even based on the data given by Wilper et al. In the quote from p. 2292, the 44,789 estimate of deaths associated with lack of health insurance in 2005 is assigned to the 18 – 64 population, not the whole population under 65.
Their conclusion on p. 2294, however, doesn’t mention the 18 – 64 age group, and perhaps this is what has led to the inference that the 44,789 figure for fatalities covers the whole population under age 65. In any event, the New York Times article announcing release of the study quotes or paraphrases Dr. Steffie Woolhandler liberally, but uses only the “ . . . 45,000 deaths a year in the United States, . . .” without qualification by age group. Every other citation of the study I’ve seen since its release does the same, in plain contradiction with what the quote from p. 2292 states.
Table One: Estimates of Population and Fatalities 2005 – 2012 Due to Lack of Insurance
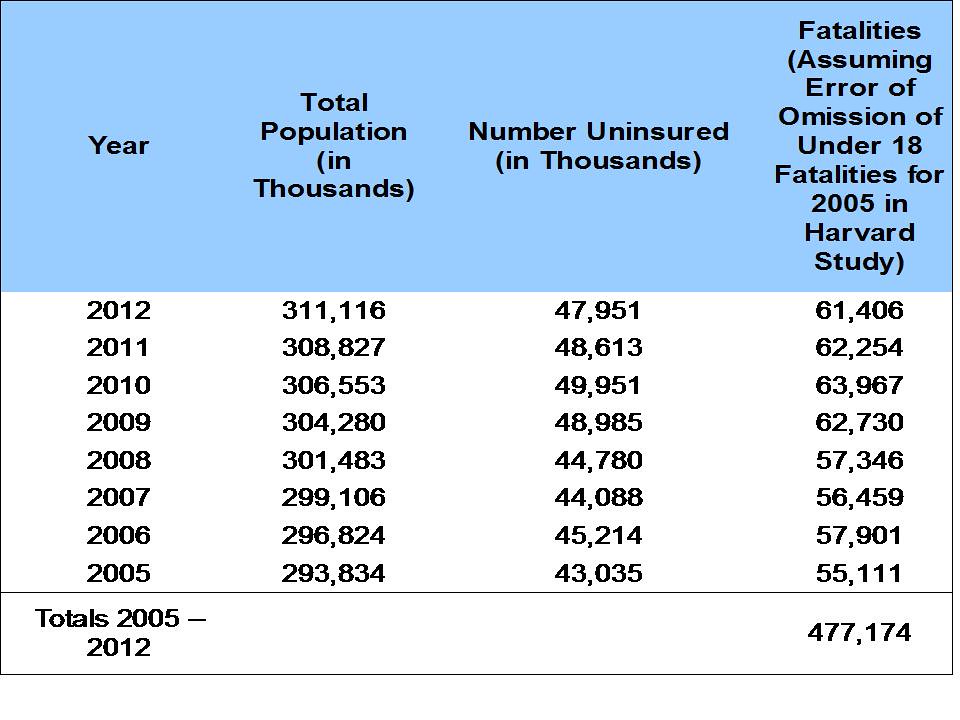
An earlier version of this post presented an alternative version of Table One including another column assuming that the 44,789 estimate in 2005 applied to the whole population, and needed to be corrected only for changes in the uninsured population changes. This update corrects that table, and the earlier post, by providing estimates based on the assumption, confirmed by Dr. Steffie Woolhandler in personal correspondence, that the 44,789 estimate applied only to the 18 – 64 group. The table also refers to the estimates as fatalities assuming an error of omission of the under 18 and over 64 uninsured groups. This “error” isn’t one from the viewpoint of the researchers who evidently intended their estimates to apply only to the 18 – 64 group, because they had questions about the validity of available data for the under 18 group.
However, from the viewpoint of a critical review of the study,I think it’s clear that the researchers stated their headline finding too vaguely in the conclusion of their article and also have failed to emphasize since publication of their article that the 44,789 estimate only applied to the 18 – 64 and not to all the uninsured, and also that it was not an annual estimate. So, I have to view that as an error of omission that has led to a very great number of mistaken citations about their headline finding since publication of their article. These mistaken citations continue to this day.
The Census Bureau report linked to above, estimates total uninsured in 2005 at 43,035,000, and uninsured children under 18 at 7,636,000. So, the total number of uninsured excluding the children is 35,399,000. It also turns out that there are 424,000 uninsured over 65. So, the uninsured population in the 18 – 64 group is estimated at 34,975,000, and this is the number of insured on which the estimate 44,789 is based, if the report of results as stated on p. 2292 is NOT in error.
The ratio of the death estimate to the uninsured population estimate in the 18 – 64 group is 44,789 to 34,975,000, or .0012806. Applying that ratio to the population of uninsured given by the census data for 2005 – 2012 gives the death estimates in the rightmost column of Table One. In effect, I’m assuming that the hazard ratio, on which the 2005 estimate is based, is constant over the period 2005 – 2012. It may not be, but I know of no data to the contrary. So, until there’s new data I think that assumption is the best one we can make.
Conclusions
In the Harvard Study, the authors mention various limitations of the study. The limitations collectively suggest that the 44,789 estimate is itself a substantial underestimate of the reality. So what sense does it make to understate the problem of deaths due to lack of insurance further by continuing to cite the 2005 result without trying to update it for 1) the increases in the number of uninsured that have occurred after 2005, and 2) the uninsured in the under 18 and over 65 groups? It just gives away unnecessary ground to those who want to maintain the status quo and leave us with the fatalities their indifference to the problem is creating.
So, what am I saying? If you’re going to cite estimates of death due to lack of insurance, then please update them for changes in the size of the uninsured population before tossing them off.
Specifically, according to Table One, the problem of under-estimation of fatalities is very serious. Using the 45,000 fatalities annually number gives a total of 360,000 during 2005 – 2012. On the other hand, the estimate in Table One totals 477,174. The difference compared to the 45,000 annual fatalities assumption is 117,174, or an average of 14,647 per year, an under-estimate of the seriousness of the problem by more than 30%. This degree of under-estimation is a lost opportunity to make the opponents of Medicare for All, including both those who want no Government in health insurance at all, and supporters of the ACA face the consequences of their actions.
Since 2010, when Medicare for All would have been operative, had the choice been made to pass it in June 2009; those consequences, according to the estimates in Table One, have included approximately 188,000 fatalities due to lack of health insurance. That’s unconscionable and immoral, especially because there was another choice, a road we failed to take. Let’s hope we can get on that road again rather than having to wait for it to be blindingly obvious that beyond all the spin, a neoliberal, market-placed based system of health insurance, can only lead to injustice, more death and misery for many Americans.


8 responses to “Are Deaths Due to Lack of Health Insurance Seriously Underestimated? Update”